Figure 8.
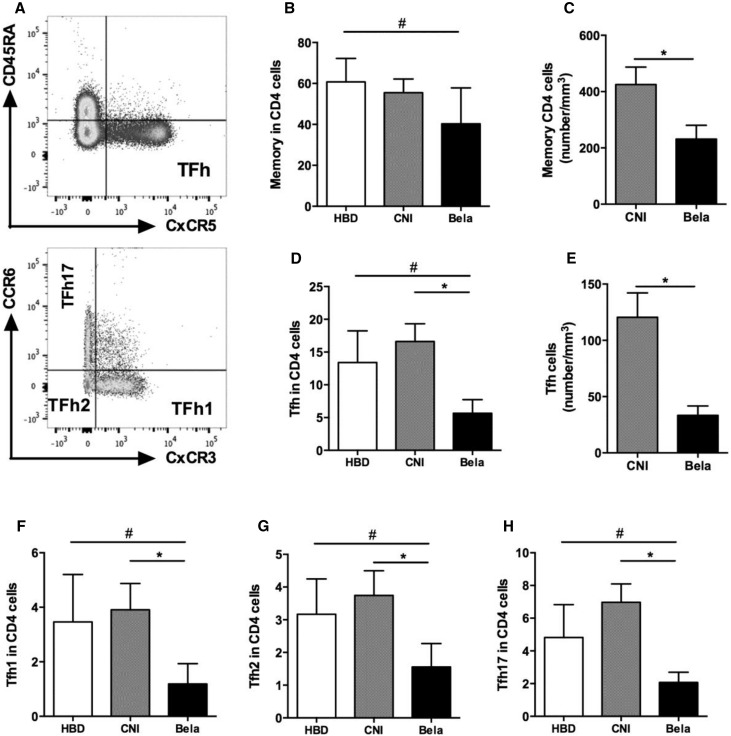
KTRs treated with Belatacept display decreased proportion of circulating Tfh. (A) Representative dot plot showing gating strategy of memory (CD4+CD45RA−) T cells and Tfhs (CD4+CD45RA−CXCR5+) (upper panel) as well as Tfh subsets: Tfh17 (CCR6+CXCR3), Tfh2 (CCR6−CXCR3−), and Tfh1 (CCR6−CXCR3+; lower panel). (B) Proportion and (C) number of memory CD4 cells (CD45RA− cells) in CD4+ cells. (D) Proportion and (E) number of Tfhs (CD45RA−CXCR5+ cells) in CD4+ cells. (F–H) Proportions of (F) Tfh1 (CCR6−CXCR3+ cells), (G) Tfh2 (CCR6−CXCR3−), and (H) Tfh17 (CCR6+CXCR3−) in CD4+ cells. Data are given as mean±SEM for each group (Belatacept, n=10; CNI, n=8; HBD, n=10). Bela, Belatacept. *P<0.05 versus CNI (Kruskal–Wallis test [D and F–H] or Mann–Whitney U test [C and E]); #P<0.05 versus HBD (Kruskal–Wallis test [B, D, and F–H]).

