Figure 1.
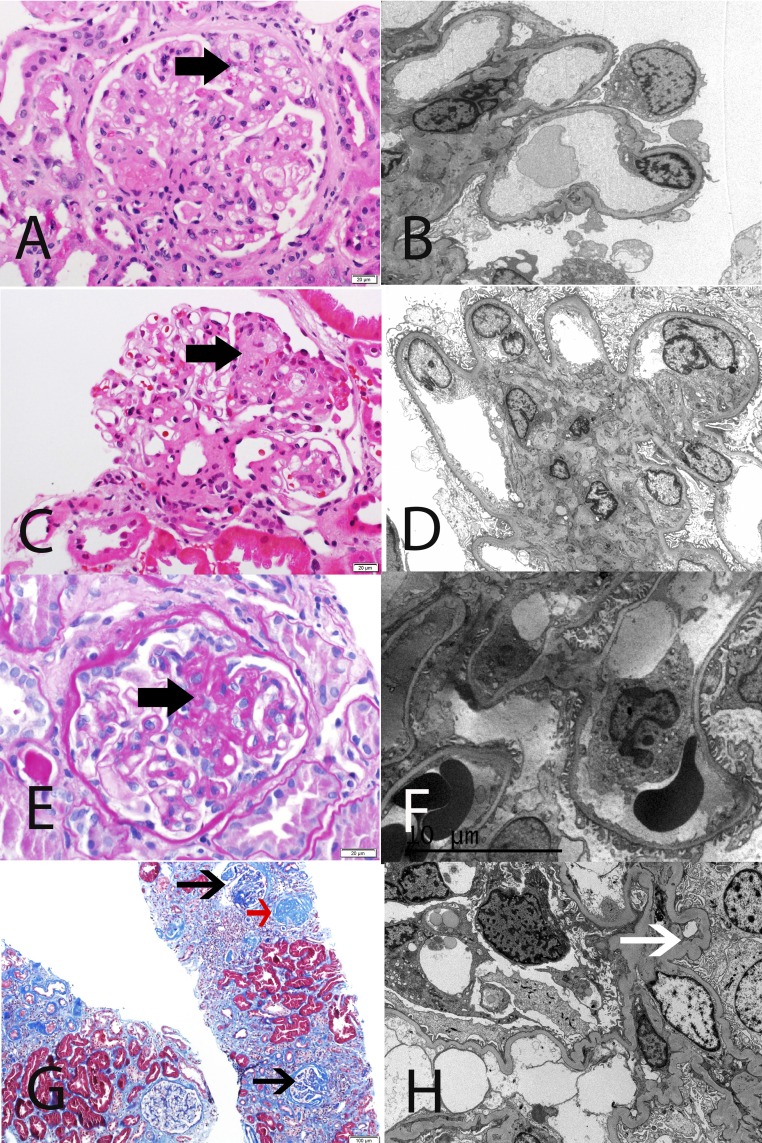
Representative LM and EM findings in FSGS and FGGS. (A and B) Primary FSGS in a 61-year-old white man with serum creatinine 1.5 mg/dl, proteinuria 14.2 g/24 h, and serum albumin 2.5 mg/dl. LM shows segmental sclerosis, and EM highlights diffuse FPE. (C and D) Maladaptive FSGS in a 53-year-old white man with serum creatinine 1.9 mg/dl, proteinuria 5.8 g/24 h, and serum albumin 4.1 mg/dl. LM shows segmental sclerosis, and EM reveals well preserved foot processes. (E and F) Genetic FSGS in a 39-year-old white man with familial history of PLCE1 mutation, serum creatinine 1.3 mg/dl, proteinuria 2.0 g/24 h, and serum albumin 4 g/dl. LM shows segmental sclerosis, and EM features only minimal FPE. (G and H) FGGS in a 38-year-old black man with a long history of uncontrolled hypertension, serum creatinine 5.1 mg/dl, proteinuria 2.8 g/24 h, and serum albumin 4.3 g/dl. LM shows ischemic changes, as well as a globally sclerosed glomerulus (red arrow), and EM shows relatively well preserved foot processes. Note ischemic capillary loops (white arrow). (A, C, E) Thick black arrow points to segmental sclerosis, and (G) thin black arrow points to ischemic glomeruli. (A and C) Hematoxylin and eosin. (E) Periodic acid–Schiff. (G) Masson trichrome stain. Original magnification, ×40 in A, C, and E; ×2500 in B; ×3000 in D; ×3500 in F; ×10 in G; ×5000 in H.

