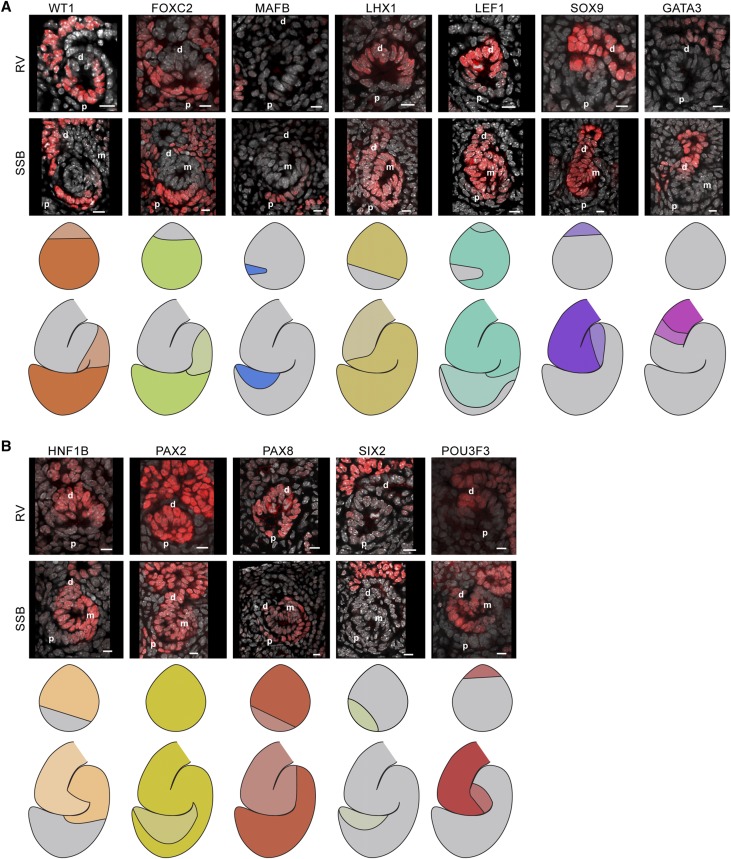
Figure 4.
Transcription factor maps in the mouse renal vesicle and SSB nephron. (A and B) Single-channel immunofluorescent stains with DAPI showing transcription factor localization patterns in renal vesicles and SSB nephrons. Nephron model schematics indicate where the transcription factor is present; a two-level color scheme used to indicate strong and weak detection where applicable. Scale bars indicate 10 µm. Proximal (p), medial (m), and distal (d) segments indicated on fields.

