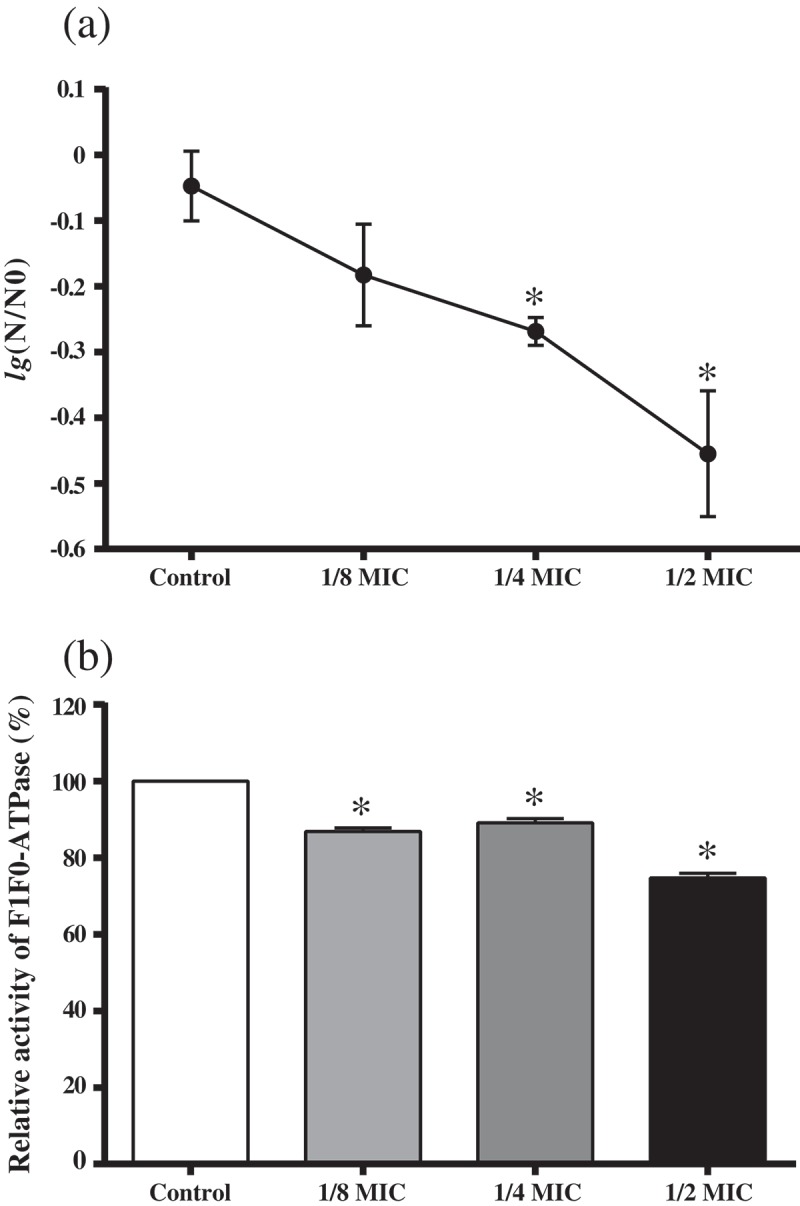
Figure 3.

Effects of GH12 on aciduricity of S. mutans. (a) The survival rate of S. mutans at pH 5.0. N 0 and N represent CFU counts before and after 2 h treatment in pH 5.0 culture, respectively. (b) Relative activity of F1F0-ATPase of S. mutans. Data are presented as means ± standard deviations.
*P < 0.05: significantly different from the vehicle control (sterile deionized water).
