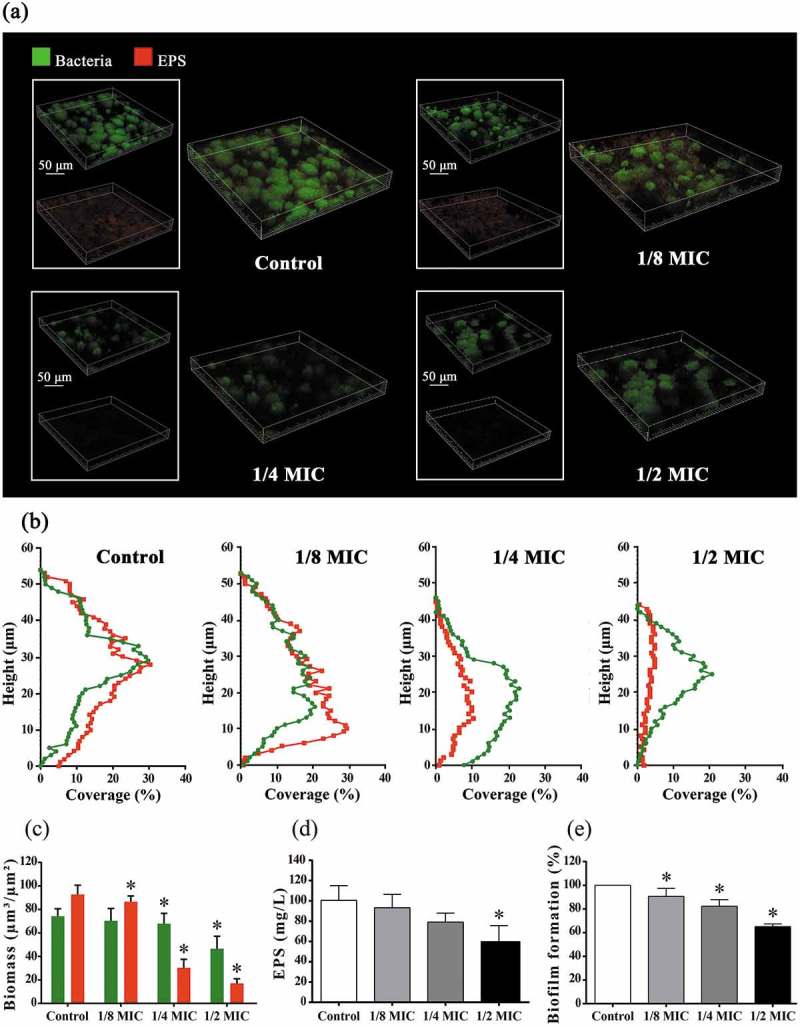
Figure 4.

Effects of GH12 on polysaccharides synthesis and biofilm of S. mutans. (a) Three-dimensional CLSM image S. mutans biofilm (bacteria, stained green; EPS, stained red). (b) Vertical distribution of bacteria and EPS calculated from CLSM imaging data sets. (c) The biomass of EPS and bacteria, calculated according to five random sights of biofilms by COMSTATA. (d) Quantitative data of the water-insoluble EPS amount of S. mutans biofilms measured by the anthrone method. (e) Quantitative data of the S. mutans biofilm formation measured by crystal violet dye. Data are presented as means ± standard deviations.
*P < 0.05: significantly different from the vehicle control (sterile deionized water).
