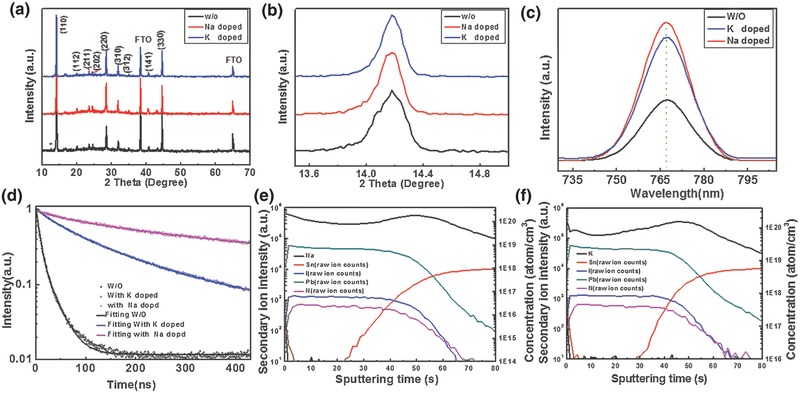
Figure 2.

a) The XRD (X‐ray diffraction) patterns, b) the enlarged comparison of (110) diffraction peak, c) the steady‐state photoluminescence (PL) spectra, and d) time‐resolved photoluminescence (TR‐PL) spectroscopy based on the glass/perovskite structure with Na+, K+ doped and the control sample without doping. e,f) The element distribution of Na+, K+ doped perovskite absorber layer measured by SIMS (secondary ion mass spectrometer) (note that the contents of Na and K were quantified by the Si standard while the other element contents were recorded as the raw ion counts).
