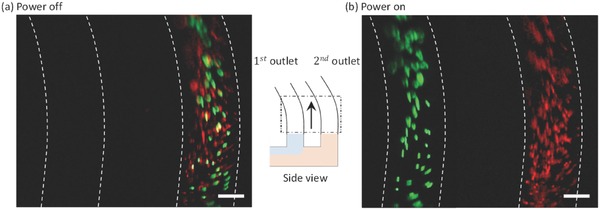
Figure 4.

A side view graphic supporting the photographic images at the outlet pipes a) Power off: a control experiment showing that particles of different sizes were collected through the second outlet. b) Power on: larger (green) and smaller (red) particles were collected through the first outlet and second outlet, respectively. Scale bar: 250 µm.
