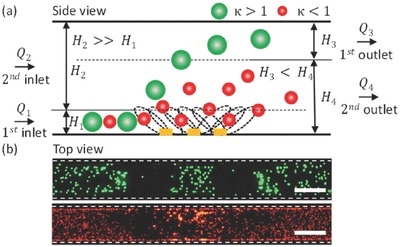
Figure 7.

a) A side view schematic diagram illustrating the height of the sheath flow and the mixed particle flow within sections of the microchannel. Particles with κ > 1 were affected by the ARF, whereas particles with κ < 1 were predominantly influenced by the streaming flow. b) Top view of the experimental images, illustrating the effects of SAWs on particles of different sizes. Scale bar: 250 µm.
