Figure 8.

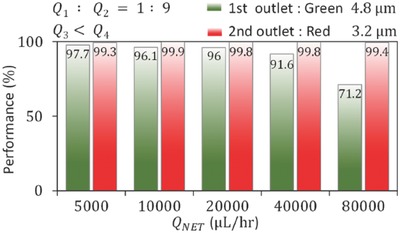
Purity and recovery measures at different net flow rates Q NET by holding the conditions (Q 1/Q 2 = 1/9) and (Q 3 < Q 4) for the isolation of green, 4.8 µm, and red, 3.2 µm particles.

Purity and recovery measures at different net flow rates Q NET by holding the conditions (Q 1/Q 2 = 1/9) and (Q 3 < Q 4) for the isolation of green, 4.8 µm, and red, 3.2 µm particles.