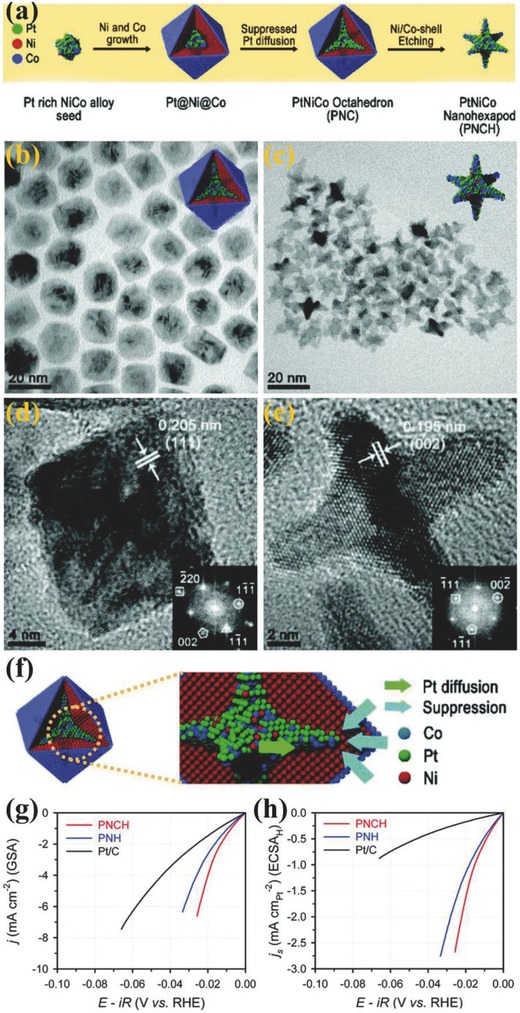
Figure 4.

a) Schematic illustration of the formation process of phase segregated Pt–Ni–Co nanostructures. TEM images of b) PNC and c) PNCH with a corresponding inset model. HRTEM with FFT images (insets) of d) PNC and e) PNCH along the 〈110〉 zone axis. The white marks in HRTEM images represent Ni (d111 = 0.205 nm) and Pt (d200 = 0.195 nm), respectively. f) Schematic illustration the structural evolution of PNC. g) HER polarization curves measured in 0.1 m KOH, h) specific current densities normalized by Pt ECSAH. Reproduced with permission.68 Copyright 2016, Royal Society of Chemistry.
