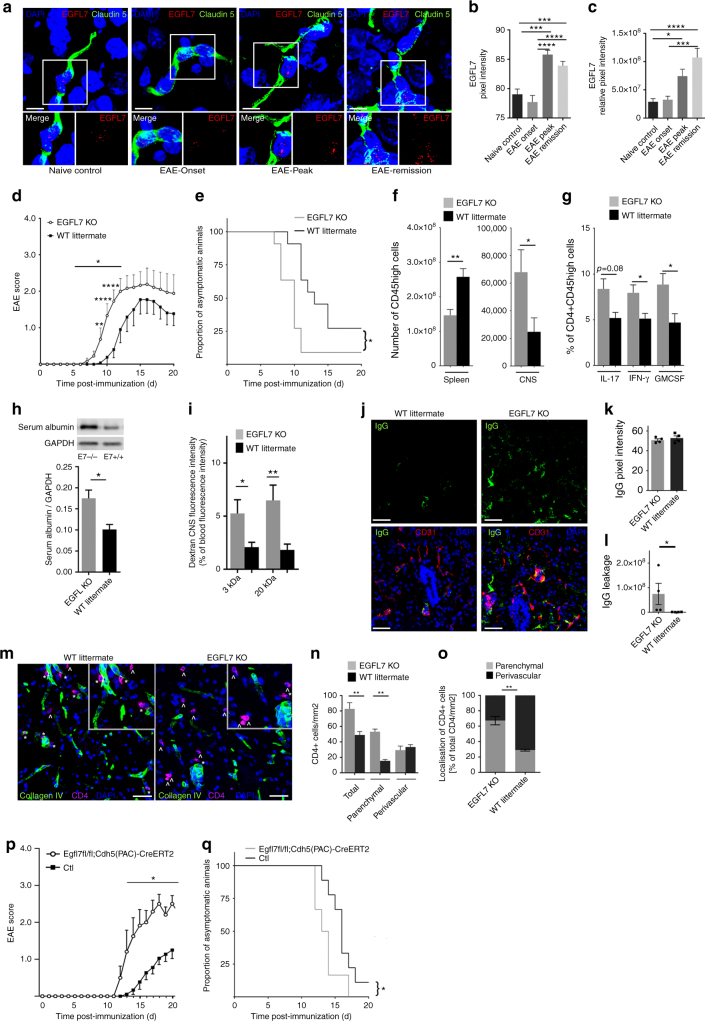
Fig. 3.
EGFL7-KO is associated with an earlier onset of EAE and an increased CNS immune cell infiltration. a EGFL7 expression (red) using FISH and immunofluorescence (claudin 5, green) in cerebellum, brainstem, and spinal cord of WT C57Bl/6 naïve control versus MOG35–55-immunized mice at EAE onset (d10), peak (d14) and remission (d25). Images (brainstem) representative of n ≥ 10 sections/mouse, 5 mice/time point. b, c Semi-quantitative analysis of EGFL7 expression according to (b) mean pixel intensity and (c) relative pixel intensity (mean pixel intensity × area). d EAE course and e proportion of asymptomatic mice in MOG35–55-immunized EGFL7-KO versus WT; n = 12 mice/group, two pooled independent experiments. f Numbers of CD45High immune cells in spleen and CNS (brain and spinal cord) and g cytokine expression by CNS-infiltrating CD4 T lymphocytes. n = 5–6 mice/group, EAE d11. h, i BBB integrity in brain and spinal cord of EGFL7-KO versus WT: h Western Blot for serum albumin n = 5 mice/group, EAE d11; i in vivo permeability assay with fluorescently-labeled dextrans. n = 8 mice/group, EAE d13. j–l IgG leakage assessed by (j) immunofluorescence on spinal cord sections from representative EGFL7-KO or WT mice. k, l Semi-quantitative analysis of IgG signal (green) in CNS (cerebellum, brainstem, spinal cord) according to (k) mean and (l) relative pixel intensities. n ≥ 5 sections/mouse, 4 mice/group, EAE d10. m–o Localization of CD4+ cells in cerebellum, brainstem, and spinal cord of EGFL7-KO versus WT, n = 5 mice/group, EAE d13. m Representative images (brainstem). CD4+ cells (purple) without contact to collagen IV (green) considered invading into CNS parenchyma (^); cells in the immediate vicinity of collagen IV considered perivascular (*). n Total number/mm2 and o proportion of CD4+ cells invading CNS with respect to their localization. p EAE course and q proportion of asymptomatic mice in MOG35–55-immunized Egfl7fl/fl;Cdh5(PAC)-CreERT2 males versus controls; n = 6 and 9 mice/group, respectively, two pooled independent experiments. Scale bars = 10 µm (a), 50 μm (j, m). Statistical analysis: one-way ANOVA with Tukey’s test (b, c), two-way repeated measures ANOVA with multiple comparisons test (d, p), Mantel-Cox test (e, q), Mann-Whitney U-test (b, c, f–o). *p < 0.05, **p < 0.01, ***p < 0.001, ****p < 0.0001. Data presented as mean ± SEM

