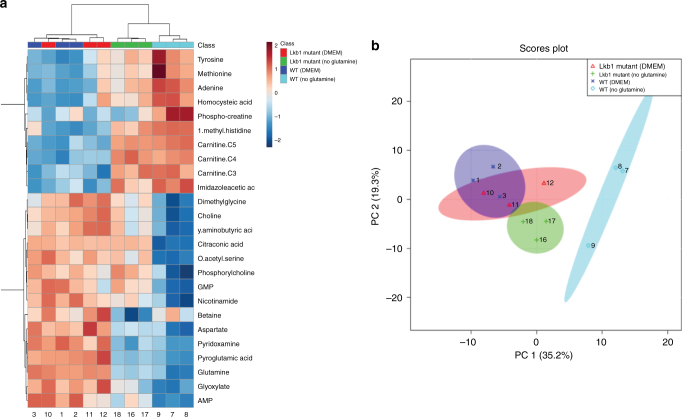
Fig. 3.
Metabolomics analysis of wild-type and Lkb1 mutant kidneys. Heatmap showing relative abundance of the 25 most significantly affected metabolites extracted from samples of cultured kidneys from embryonic day 13.5 wild-type and Lkb1 mutant kidneys cultured in control media (DMEM) and DMEM-glutamine. The colorbar presented is a log2 scale (a). Principal Component Analysis (PCA) of wild-type and Lkb1 mutant kidneys in the presence and absence of glutamine (b)

