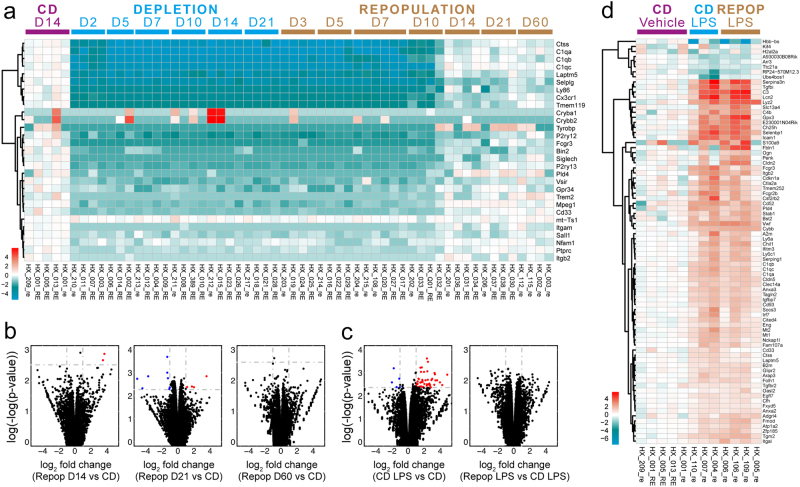
Fig. 7. The transcriptomes of the retina are little influenced by repopulated microglia.
a The heat map of retinal DEGs during microglial depletion and repopulation. b The volcano maps indicate the DEGs in microglial repopulated retinas compared to naïve retinas. c The volcano plots indicate the DEGs of the LPS challenged retinas. d The heat map of DEGs of the LPS challenged and vehicle treated retinas. CD: control diet, Repop: repopulation

