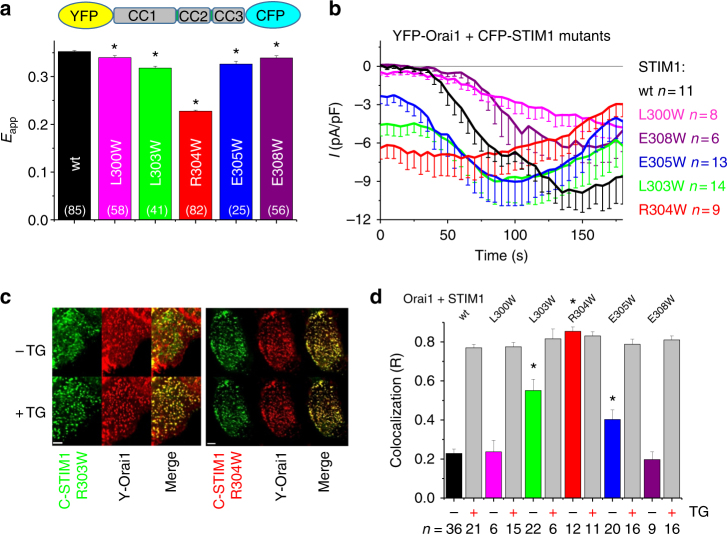
Fig. 3.
High specificity of STIM1 amino acid position 304. All experiments performed with HEK 293 cells. a Bar diagram of FRET measurements of conformational sensor YFP-OASF-CFP wt (black) and mutants (L300W (magenta), L303W (green), R304W (red), E305W (blue), E308W (violet)). *Significant difference (p < 0.05) to wt. n-number in brackets. b Patch clamp recordings of YFP-Orai1 + CFP-STIM1 wt (black) and mutants (color code corresponds to a). c Representative confocal images of cells co-expressing CFP-STIM1 R303W + YFP-Orai1 (left) and CFP-STIM1 R304W + YFP-Orai1 (right) in resting (−TG) as well as store-depleted (+TG) conditions. Merge shows localization of both CFP-STIM1 and YFP-Orai1 signals in one cell. Length of scale bars correspond to 5 µm. d Bar diagram representing co-localization experiments using confocal microscopy of HEK293 cells co-expressing YFP-Orai1 and CFP-STIM1 wt and mutants, respectively, in both resting (−TG) as well as store-depleted (+TG) conditions (color code corresponds to a). *Significant difference (p < 0.05) to wt (only – TG). Error bars are defined as SEM. Statistics are Student’s t‐test

