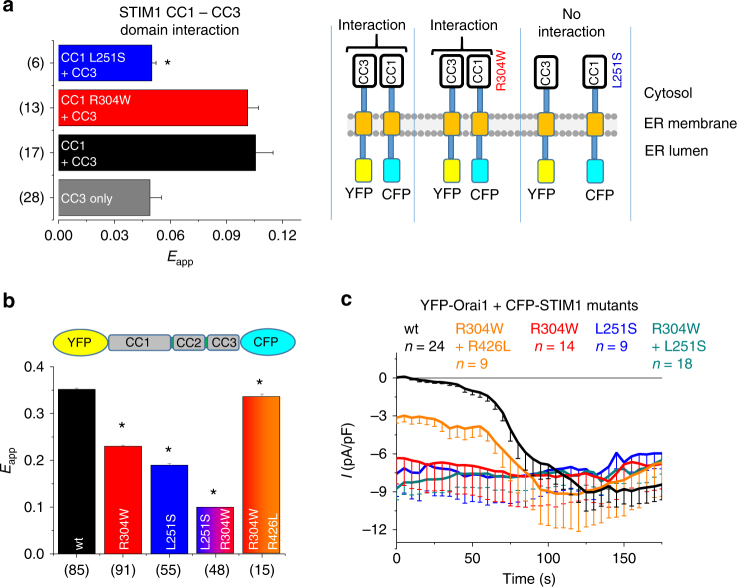
Fig. 5.
STIM1 CC1 R304W does not perturb the CC1–CC3 fragment interaction. All experiments performed with HEK 293 cells. a Bar diagram of FRET analysis (FIRE system) showing CTMG-CC3 + YTMG-CC1 wt (black) and mutants (red, R304W; blue, L251S), respectively. Control (gray) represents YTMG-CC1 co-expressed with empty CTMG. *Significant difference (p < 0.05) to (CC1 + CC3). n-number in brackets. b YFP-OASF-CFP conformational sensor FRET analysis with wt (black), R304W (red), L251S (blue), L251S + R304W (red + blue), and R304W + R426L (red + orange). *Significant difference (p < 0.05) to wt. n-number in brackets. c Patch clamp recordings of HEK cells overexpressing YFP-Orai1 + CFP-STIM1 wt (black) or mutants (R304W; L251S; double L251S + R304W; and double R304W + R426L). Error bars are defined as SEM. Statistics are Student’s t‐test

