Fig. 7.
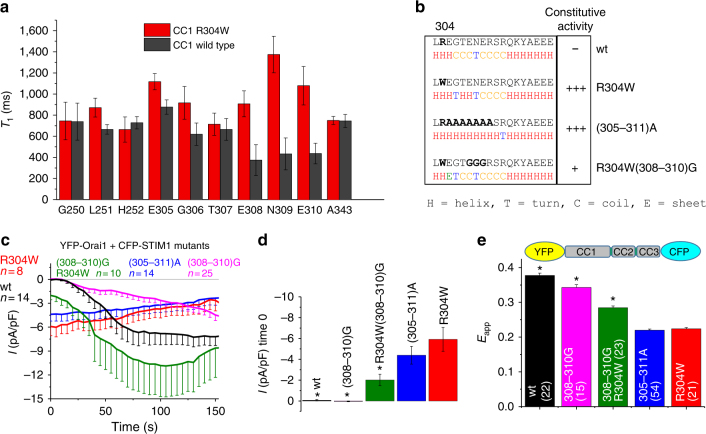
R304W induces formation of additional helical turn. a NMR 15N-T1 relaxation times (70 MHz) for peptide bond 15N of selected assigned residues in CC1 wt (black bars) and CC1 R304W (red bars). Error bars are defined as SD. b Bioinformatic secondary structure prediction highlighting CC1 region aa303–320. Predictions performed with sequences of wt, R304W, (305–311)A, and R304W (308–310)G, respectively. c Patch clamp recordings of HEK 293 cells co-expressing YFP-Orai1 + CFP-STIM1 wt (black) and mutants (R304W (red); R304W (308–310)G (green); (305–311)A (blue); (308–310)G (magenta)). Color-coded bar diagram of initial currents at time 0 of patch clamp recordings are represented in d. *Significant difference (p < 0.05) to R304W. e YFP-OASF-CFP conformational sensor FRET analysis with wt (black), (308–310)G (magenta), R304W (308–310)G (green); (305–311)A (blue), and R304W (red)). *Significant difference (p < 0.05) to R304W. n-number in brackets. Error bars are defined as SEM. Statistics are Student’s t‐test

