FIGURE 10.

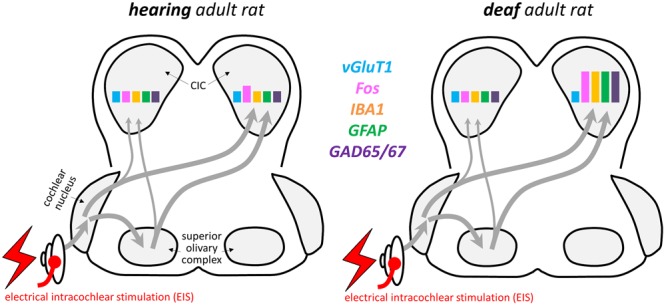
Summary diagram qualitatively comparing major molecular responses in the brains of hearing and deaf rats after EIS in CIC. Arrows show basic connectivity of the lower auditory brainstem.

Summary diagram qualitatively comparing major molecular responses in the brains of hearing and deaf rats after EIS in CIC. Arrows show basic connectivity of the lower auditory brainstem.