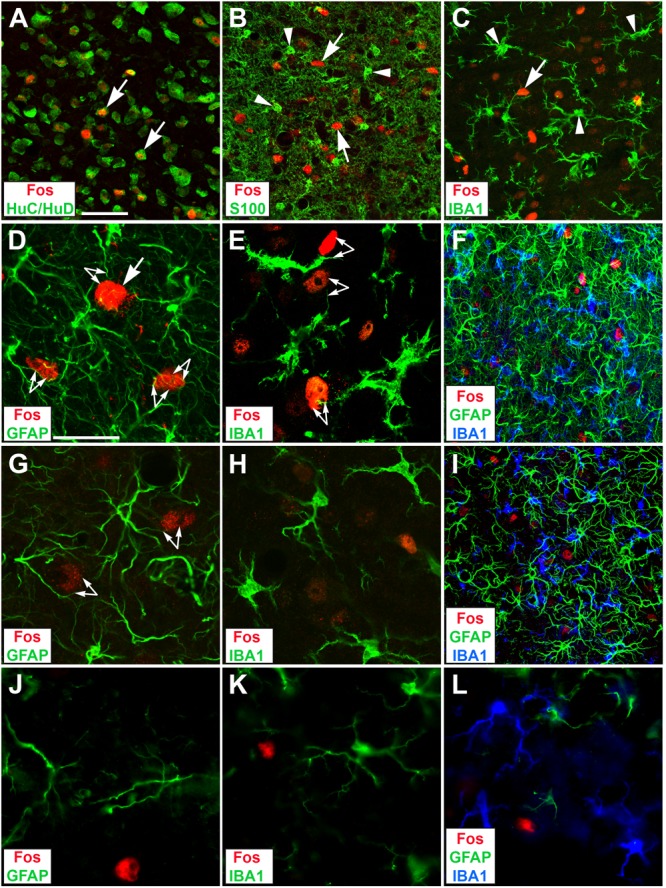
FIGURE 7.

Identity and neighborhood of Fos-positive cells in the CIC of deafened rats by 1 (B–F) or 7 d EIS (G–I), and of hearing rats by 1 d EIS (J–L) in confocal micrographs. (A) Whenever a collicular neuron contained a Fos-positive nucleus (arrows), it was located in HuC-/HuD-positive cytoplasm indicative of nerve cells. (B) Fos-positive nuclei (arrows) were never found in S100 positive cell bodies (some indicated by arrowheads) indicative of astrocytic cell bodies. (C) Fos-positive nuclei (arrow) were never found in IBA1 positive cell bodies indicative of microglia (some indicated by arrowheads). (D) Fos-positive cells (one indicated by arrow) were embedded in a meshwork of astrocytic processes that shared the neighborhood and showed distinct approximations (arrow-pairs). (E) Fos-positive cells were embedded in a dense population of microglia processes that showed specific spatial neuron–glia appositions (arrow-pairs). (F) The aggregations of glial processes were particularly dense where neurons showed strong Fos immunoreactivity and again showed many incidences of approximation between astrocytic processes and Fos-positive nuclei. (G) By 7 d EIS, Fos staining was waning and astrocyte aggregations have slightly eased. (H) By that time, microglia are still prominent but their acanthoid appearance seen by 1 d EIS (E) is no longer obvious. (I) At lower magnification a moderate decrease of glia aggregations can be recognized and approximations of glia processes and neurons recognizable by Fos staining are less evident by 7 d EIS compared to 1 d EIS (F). (J) When nh rats were stimulated for 1 d astrocytic processes were sparse and approximations with Fos-positive neurons were rare. (K) Upon 1 d EIS, hearing rats did not change microglia morphology against controls, leaving them with thin long extensions that rarely touch Fos-positive cell bodies. (L) Sparse astrocytic extensions, thin microglial dendrites, and less frequent Fos-positive neurons provide few opportunities of approximations between them. Scale bar for (A–C,F,I): 50 μm, scale bar for (D,E,G,H,J,K,L): 20 μm.
