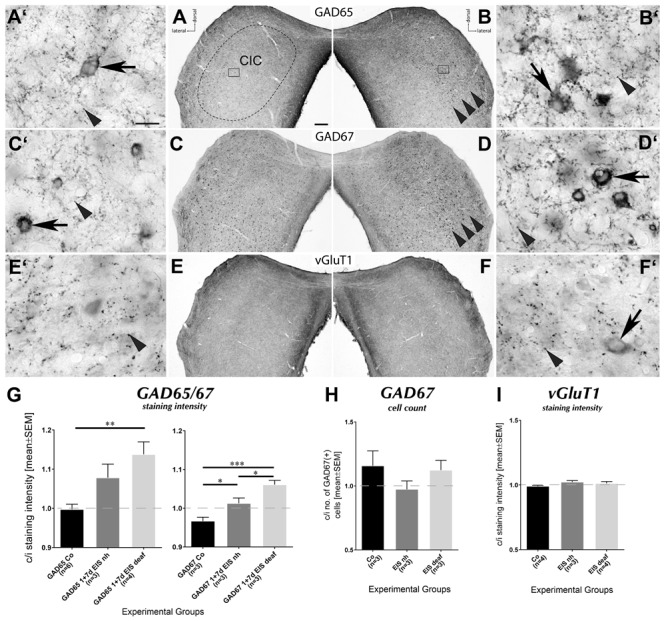
FIGURE 8.

Modulation of GABAergic circuits by 7 d EIS in deafened rats. (A,B) Sections through CIC stained for GAD65. The network of stained fibers and boutons has increased contralateral to EIS (B, arrowheads) and the number of GAD65-positive cell bodies (B′, arrow), usually very rare in i CIC (A′, arrow), has increased. (C,D) Sections through CIC stained for GAD67. The network of stained fibers and boutons has increased contralaterally to EIS (D, arrowheads). Staining intensity of GAD67-positive cell bodies, normally present in considerable number (C′, arrow), has increased contralaterally (D′, arrow). (E,F) Sections through CIC stained for vGluT1. The network of stained fibers and boutons remained unchanged under EIS (E′, F′, arrowheads), with occasional vague indications of cell body staining (F′, arrow). Scale bar for (A–F): 200 μm; scale bar for (A′–F′): 50 μm. (G) Quantification of staining for GAD65 and GAD67 presented as contralateral-to-ipsilateral ratios. In the stimulated deaf rats, a significant rise of staining intensity contralateral to EIS was seen with GAD65 and GAD67 staining. For the stimulated hearing-experienced rats, significant differences were detected for GAD67 staining intensity compared to control group and the group of stimulated deaf rats. (H) Quantification of the number of GAD67-positive cell bodies. No significant changes occurred due to EIS. (I) Quantification of staining for vGluT1 presented as contralateral-to-i ratios that remained unchanged by unilateral EIS. nh, normal hearing; n, number of animals from which data were sampled.
