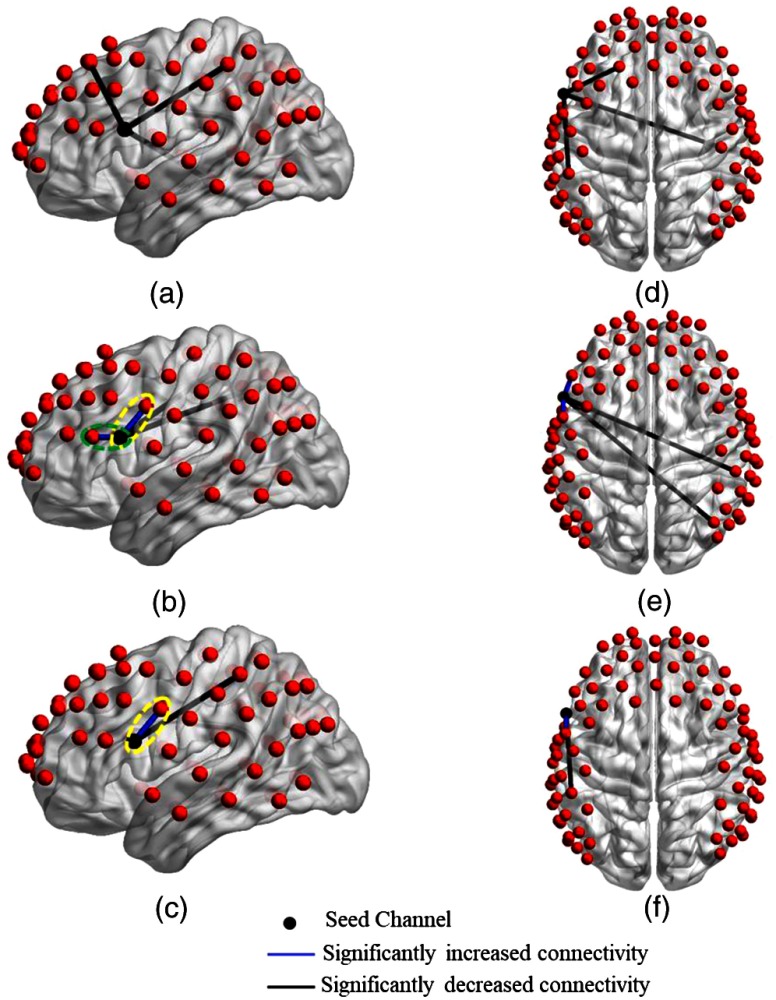
Fig. 4.
Changes in functional connectivity strength between the left Broca’s area (seed) and other cortical regions induced by different tDCS stimulation conditions. Group-level significant differences () in connectivity strength between pairs of detector locations for the no tDCS condition versus low current tDCS [(a) and (d)], versus high current tDCS [(b) and (e)], and versus after high current tDCS [(c) and (f)] stimulation conditions. Green ovals: detector pair locations showing significantly increased connectivity with the dorsolateral prefrontal area. Yellow ovals: detector pair locations showing significantly increased connectivity with the premotor and SMA areas.

