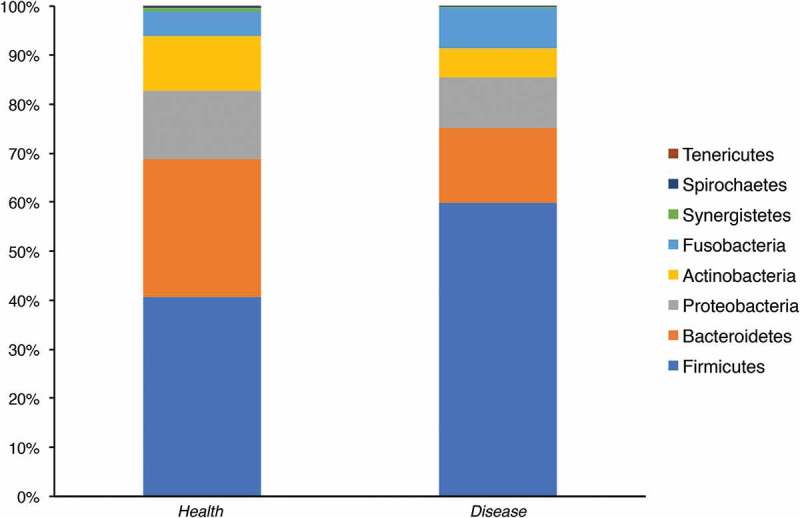
Figure 1.

Bacterial phyla detected in APS-1 patients (n = 7) and control saliva (n = 17). Comparison of microbiota in APS-1 and healthy saliva determined by sequencing the hypervariable 16S rDNA region V1-V2. Relative abundance of the different phyla in control and APS-1 samples is shown.
