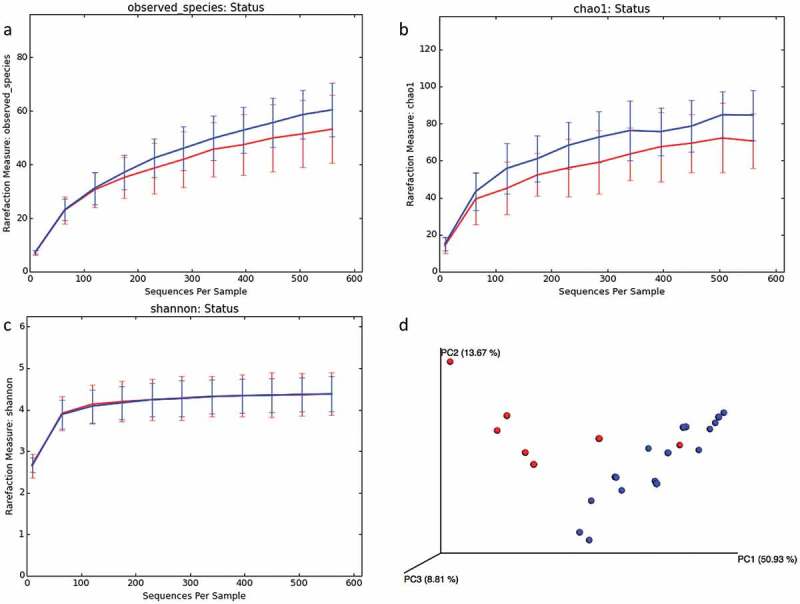
Figure 5.

Comparison of microbial diversity in saliva samples of APS-1 patients (n = 7) and health samples (n = 17). Average rarefaction curves of APS-1 and health samples reported as (a) observed species, (b) Chao1 estimator, (c) Shannon index, (d) PCoA 3D plots of all samples with distances calculated using weighed normalized UniFrac matrix. Blue curves and dots represent health samples; and red represents APS-1.
