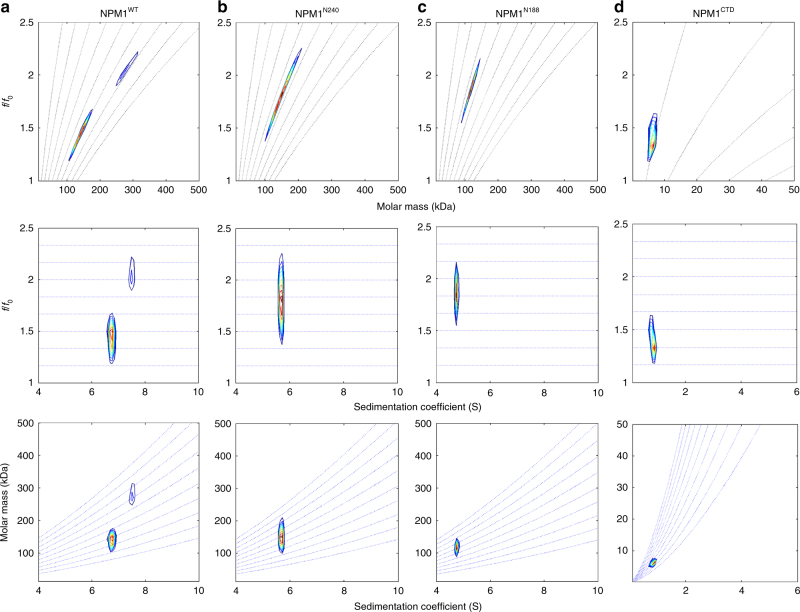
Fig. 4.
Two-dimensional size-and-shape distribution analyses of the sedimentation velocity AUC data. a NPM1, b NPM1N240, c NPM1N188, and d NPM1CTD. The transformed velocity data are shown as contour plots (heat maps) of c(M, f/f0,) (top), c(s, f/f0) (middle), and c(s, M) (bottom) with 0 fringes/S (white) to maximum value fringes/S (red), with increasing color temperature indicating higher values. Velocity data were acquired at 50,000 rpm at 20 °C in buffer comprised of 10 mM Tris, pH 7.5, 150 mM NaCl, 2 mM DTT. The sw,(f/f0)w, and M-values are listed in Supplementary Table 2

