Fig. 5.
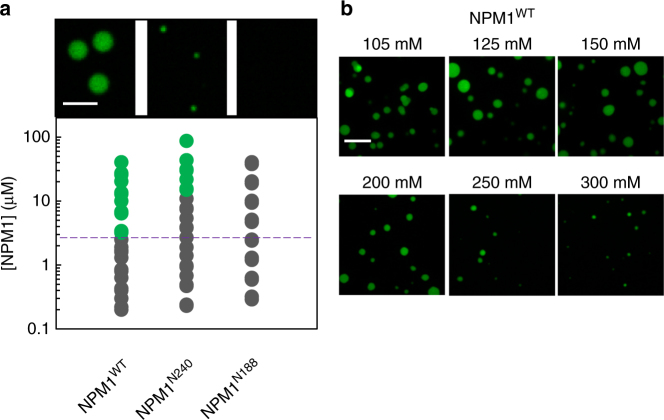
Only NPM1 constructs with an intact IDR undergo homotypic LLPS. a Phase diagrams for NPM1WT, NPM1N240 and NPM1N188 in buffer comprised of 10 mM Tris, 150 mM NaCl, 2 mM DTT, pH 7.5 in the presence of 150 mg/mL Ficoll PM70. The purple dotted line is a visual aid that represents the phase boundary for NPM1WT between the mixed (gray circles) and demixed (green circles) states. Representative microscopy images are shown for 20 µM protein samples. Scale bar = 5 µm; b confocal microscopy images of homotypic NPM1 droplets at 20 µM NPM1 in the presence of 150 mg/mL Ficoll PM70, in buffers containing the indicated NaCl concentration. Scale bar = 10 µm

