Fig. 1.
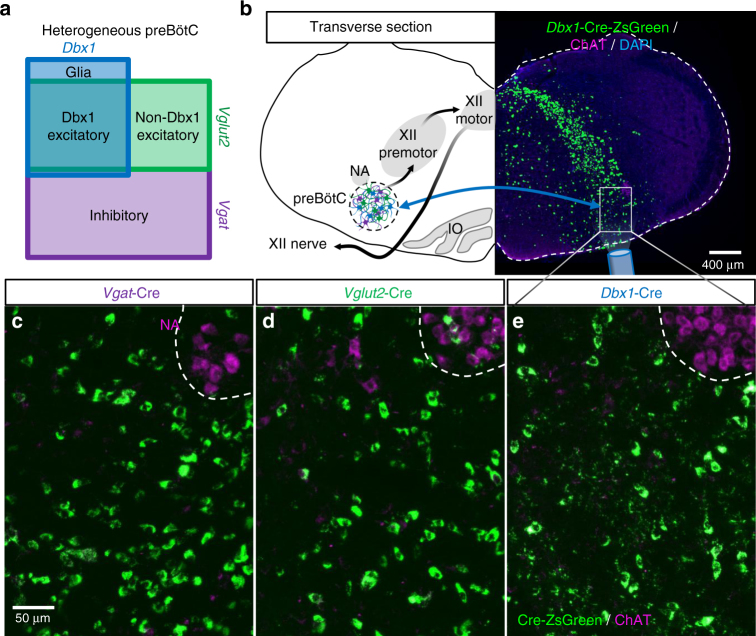
Anatomy of the heterogeneous preBötC. a Diagram showing estimated ratios of Dbx1 and non-Dbx1 excitatory and inhibitory neurons19, 24–26 with the corresponding promoters used to drive Cre expression within these preBötC subpopulations. b Schematic depicting key landmarks (NA nucleus amibiguus, IO inferior olive) and the pathway from preBötC rhythmogenesis to XII motor output and a representative 2.5× image of a transverse medullary preBötC section from an adult Dbx1-ZsGreen mouse. Blue arrows represent commissural connections between Dbx1 neurons24. c–e 20× z-projected images of Cre-dependent ZsGreen expression in preBötC neurons from VgatCre (c), Vglut2Cre (d), and Dbx1CreERT2 (e) mice. ChAT immunofluorescence demarks the NA dorsomedial to the preBötC

