
Fig. 3.
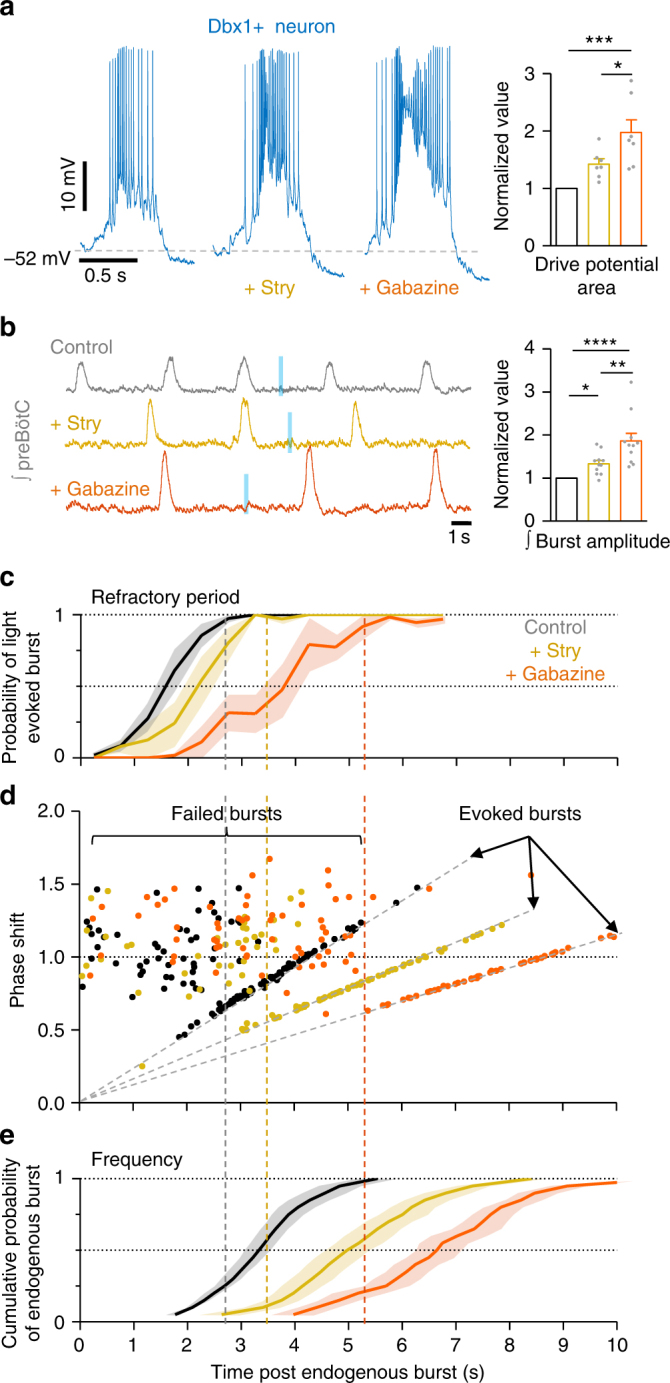
Inhibition restrains excitatory preBötC neuron activity and the refractory period. a Example Dbx1+ neuron activity under baseline conditions and following progressive blockade of glycinergic and gabaergic synaptic inhibition with strychnine (1 µM) and gabazine (1 µM), respectively. Average normalized inspiratory drive potential area (n = 7) of Dbx1+ neurons during preBötC bursts in strychnine and gabazine (*p < 0.05, ***p<0.001; means ± s.e.m.; one-way repeated measures ANOVA and Bonferroni’s multiple comparisons test). b Example of preBötC population activity from a Dbx1-ChR2 slice during inhibition block and failure to light-evoke bursts during the refractory period, and normalized burst amplitude of integrated preBötC population activity (n = 11 slices; *p < 0.05, **p<0.01, ****p<0.0001; means ± s.e.m.; Friedman test and Dunn’s multiple comparisons test). c Quantified probability of evoking a burst (0.5 s bins) relative to time post endogenous burst (s) from Dbx1-ChR2 slices during inhibition block (~100–150 trials in each condition from each slice; n = 4 slices; means ± s.e.m.). d Data from a representative Dbx1-ChR2 stimulation experiment comparing the phase shift (stimulus cycle duration/average cycle duration) elicited compared to the time of the light stimulus relative to the preceding endogenous burst. Note that in strychnine (yellow) and strychnine+gabazine (orange) failed bursts are more common for a longer duration following endogenous bursts (358 stimulations). Average data shown in Supplementary Fig 1. e Cumulative probability of a spontaneous burst (0.05 probability bins) relative to time post endogenous burst (s) from Dbx1-ChR2 slices during inhibition block (~100–150 trials in each condition from each slice; n = 4 slices; means ± s.e.m.). Vertical dashed lines correspond to the end of the refractory period and an increasing probability of spontaneous bursting