Figure 4.
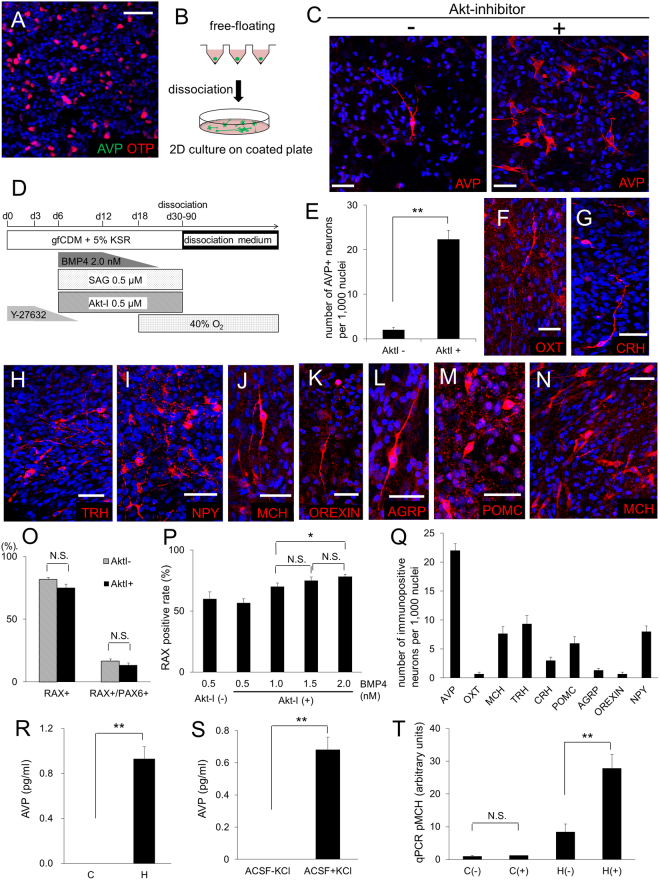
Generation of AVP-secreting hypothalamic neurons. (A) Immunostaining of a day 80 aggregate containing OTP+ cells. Few AVP+ cells were found in Transwell-cultured aggregates. AVP (green), OTP (red). (B) Schematic of 2D dissociation culture. Dissociated single cells from aggregates were attached onto coated glass-slips. (C) Effect of Akt-inhibitor on AVP induction. Immunostaining of day 150 aggregates with (right panel) or without (left panel) Akt-inhibitor treatment. AVP (red). (D) Schematic of the culture procedure for dorsal hypothalamic differentiation. (E) Number of AVP+ neurons with/without Akt-inhibitor treatment. n = 3. (F–M) Immunostaining for hypothalamic neurons in dissociation cultures treated with Akt-inhibitor. OXT (F, red), CRH (G, red), TRH (H, red), NPY (I, red), MCH (J, red), OREXIN (K, red), AGRP (L, red) and POMC (M, red). (N) MCH (red) immunostaining of an aggregate from ventral hypothalamus inducing conditions. (O) RAX and PAX6 positive rate with or without Akt-inhibitor treatment. Concentration of BMP4, SAG, and Akt-inhibitor was 1.5 nM, 0.5 μM, and 0.5 μM, respectively. RAX+/PAX6+ indicates double RAX/PAX6-positive cells. n = 3. (P) RAX positive rate with 0.5 μM SAG, 0.5 μM Akt-inhibitor, and 0.5-2.0 nM BMP4. n = 3. (Q) Number of immunopositive neurons per 1000 nuclei. n = 3. (R) AVP concentrations measured by radioimmunoassay in conditioned media of day 150 cells cultured with the Fig. 4D protocol. (C) control, using hESC-derived neocortex cells38. (H) hypothalamus, using dorsal hypothalamic neurons. n = 10. (S) AVP-release analysis measured by radioimmunoassay with or without high K stimulation on day 150. ACSF: artificial cerebrospinal fluid. n = 10. (T) pro-MCH analysis by quantitative PCR with or without nerve growth factor (NGF), dexamethasone (DEX) and lithium chloride (LiCl) stimulation on day 150.C: control, using non-hypothalamic differentiated aggregates. H: hypothalamus, using aggregates of ventral hypothalamic differentiation. (−): no stimulation. (+): with stimulation of NGF, DEX and LiCl. n = 6. For all relevant panels, nuclear counter staining: DAPI (blue), scale bar: 50 μM. Error bars represent s.e.m. *P < 0.05, **P < 0.01.

