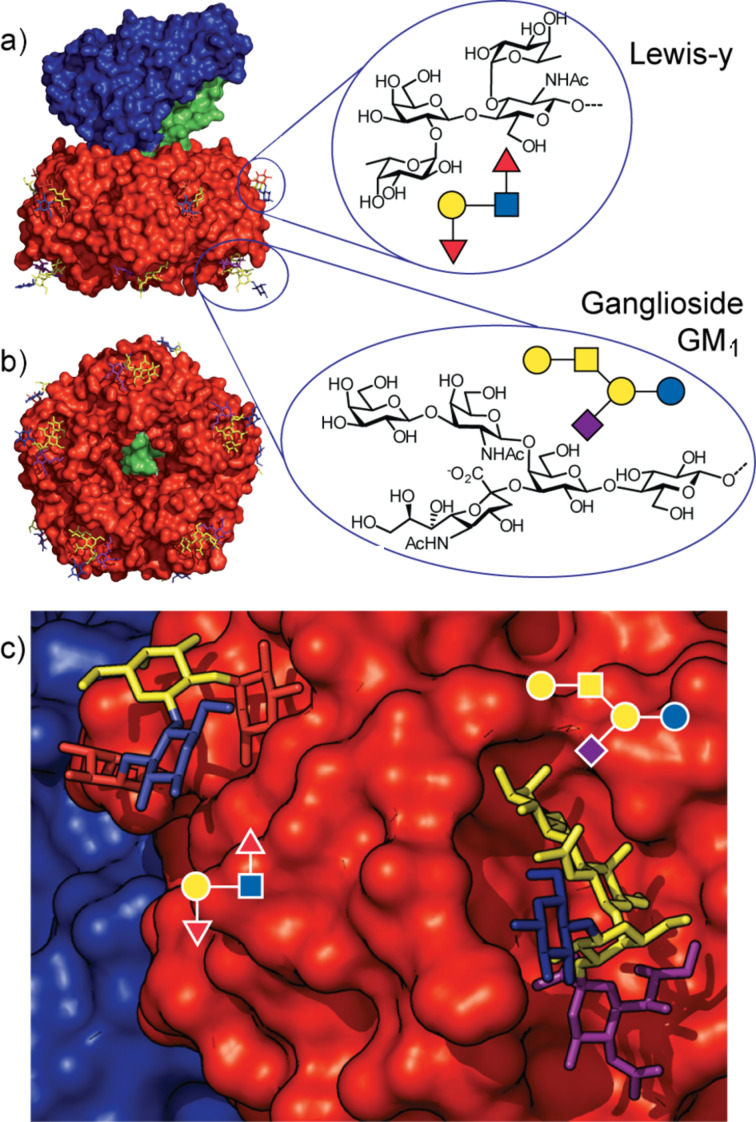
Figure 2.
a) Structure of the cholera toxin showing the location of its carbohydrate binding sites and the structures of the Lewis-y and Ganglioside GM1 ligands; A-subunit (blue), B-subunit (red) and the A2 peptide linker (green). b) Bottom face of the toxin showing the symmetry of the B-subunit and the A2 peptide linker emerging through the central channel. c) Close-up view of the two sugar binding sites. Figure prepared using the PyMOL programme from Protein Data Bank files 1XTC.pdb, 3CHB.pdb and 3EFX.pdb.

