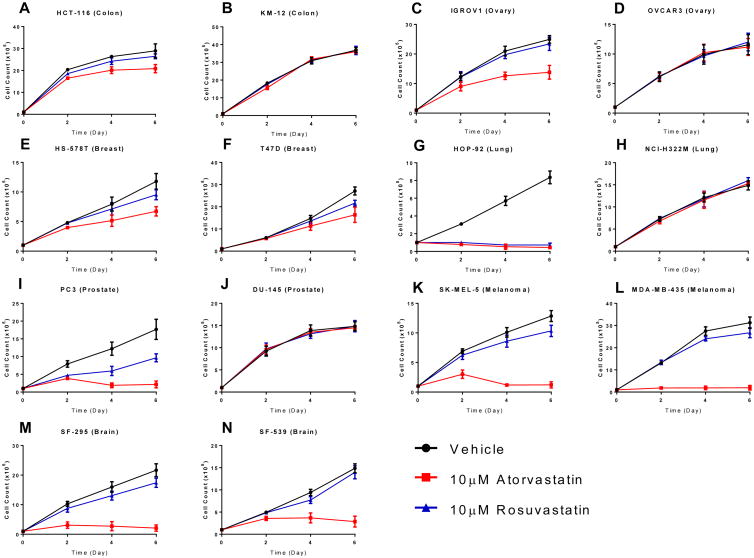
Figure 1. Growth rate of atorvastatin and rosuvastatin treated NCI-60 cancer cell lines.
Colon cancer- (A. HCT-116 and B. KM-12), ovarian cancer- (C. IGROV1 and D. OVCAR3), breast cancer- (E. HS578T and F. T47D), lung cancer- (G. HOP-92 and H. NCI-H322M), prostate cancer- (I. PC-3 and J. DU-145), melanoma- (K. SK-MEL-5 and L. MDA-MB-435), and brain cancer- (M. SF-295 and N. SF-539) cell lines from the NCI-60 cancer cell line collection were treated with 10 μM atorvastatin (pink line), 10 μM rosuvastatin (blue line), or DMSO vehicle control (black line) and cell growth was quantified at 2, 4, and 6 days through direct cell counting. The results are representative of three independent experiments. Error bars represent the standard deviation (n=3).

