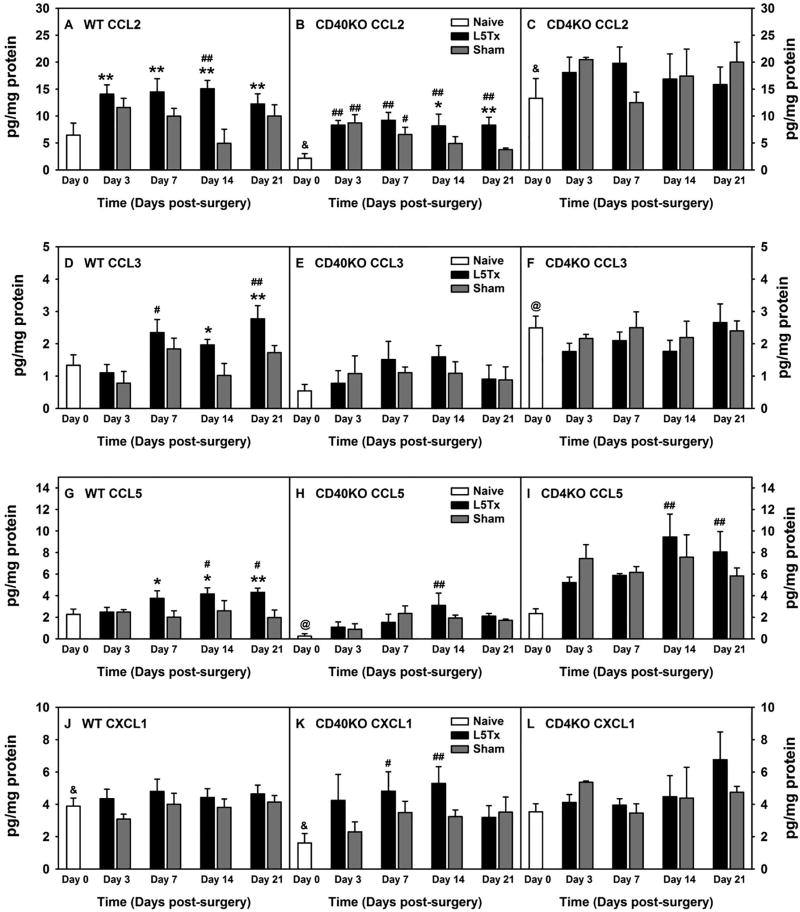
Figure 1. Lumbar spinal cord chemokine expression at the protein level (absolute levels) following L5Tx in WT, CD40 KO, and CD4 KO mice.
WT BALB/c (A, D, G and J), CD40 KO (B, E, H, and K), and CD4 KO (C, F, I and L) mice were randomly assigned to naïve, L5Tx, or sham groups. Lumbar spinal cords were collected before surgery (naïve; i.e. “Day 0” in the graph), and days 3, 7, 14, and 21 after surgery. Chemokines: CXCL1 (KC), CCL1 (TCA-3), CCL2 (MCP-1), CCL3 (MIP-1α), CCL5 (RANTES), CCL11 (eotaxin), CCL17 (TARC), and CCL22 (MDC) within spinal cord samples were determined via a multiplex assay by Quansys Biosciences. Data for chemokines, CCL2 (A–C), CCL3 (D–F), CCL5 (G–I), and CXCL1 (J–L) are presented as mean ± SEM (WT n = 6–10, CD40 KO n = 6 and CD4 KO n = 3). & p < 0.05 between indicated naïve groups for the same chemokine; @ p < 0.05 compared to naïve groups from all other genotype of mice for the same chemokine; # p < 0.1 and ## p < 0.05 compared to corresponding naïve group; and * p < 0.1 and ** p < 0.05 compared to corresponding sham group.

