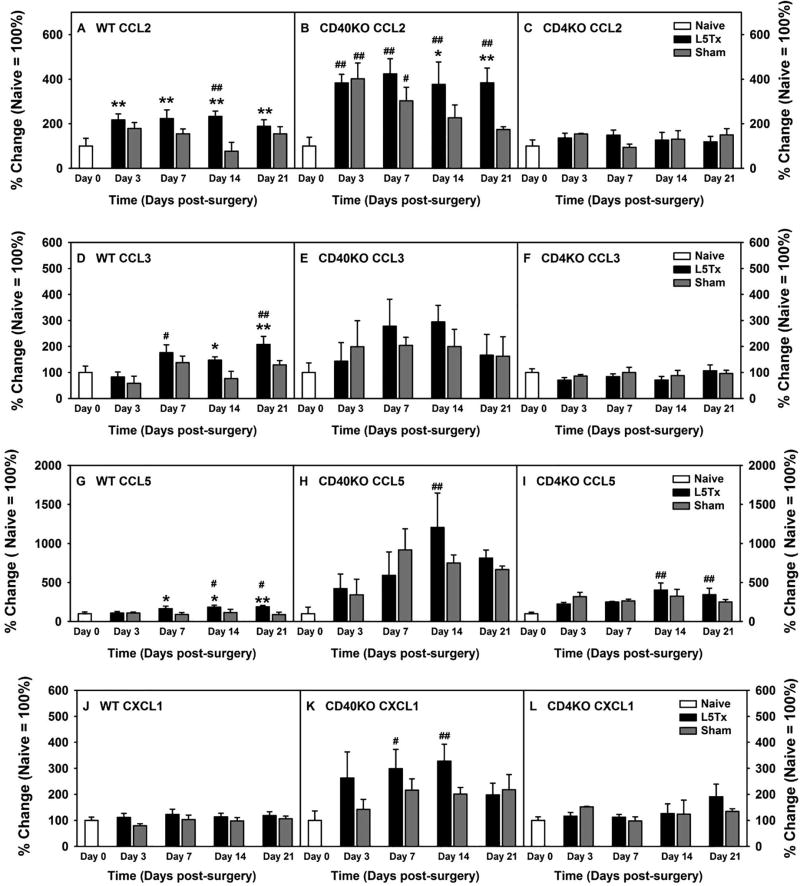
Figure 2. Lumbar spinal cord chemokine expression at the protein level (percentage changes) following L5Tx in WT, CD40 KO, and CD4 KO mice.
Data were obtained as described in Figure 1. Due to significant differences at the basal levels of the chemokines shown in Figure 1, percentage change of each chemokine following each surgery within each genotype of mice were calculated (naive = 100% within each genotype) and presented here. All letter labels (A–L) used in Figure 2 are the same as that in Figure 1. Data are presented as mean ± SEM (WT n = 6–10, CD40 KO n = 6 and CD4 KO n = 3). & p < 0.05 between indicated naïve groups for the same chemokine; @ p < 0.05 compared to naïve groups from all other genotype of mice for the same chemokine; # p < 0.1 and ## p < 0.05 compared to corresponding naïve group; and * p < 0.1 and ** p < 0.05 compared to corresponding sham group. “Day 0” = naive.

