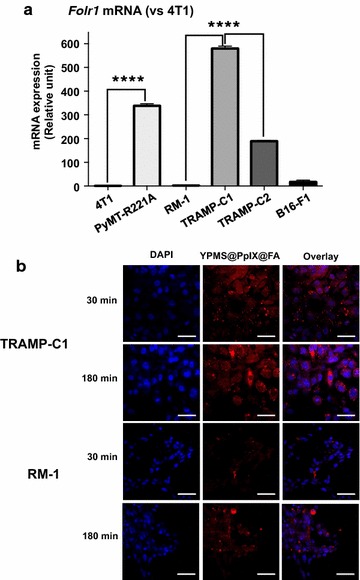
Fig. 4.

Preferential uptake of YPMS@PpIX@FA in TRAMP-C1 cells. a Analysis of Folr1 mRNA levels in various mouse cancer cell lines. Results are expressed as the mean ± SEM (n = 3). ****p < 0.0001 using a 1-way ANOVA with a Tukey posttest. b Representative confocal fluorescence images of TRAMP-C1 and RM-1 cells treated for 30 or 180 min with YPMS@PpIX@FA nanoparticles and counterstained with DAPI. Scale bar, 50 µm
