Fig. 8.

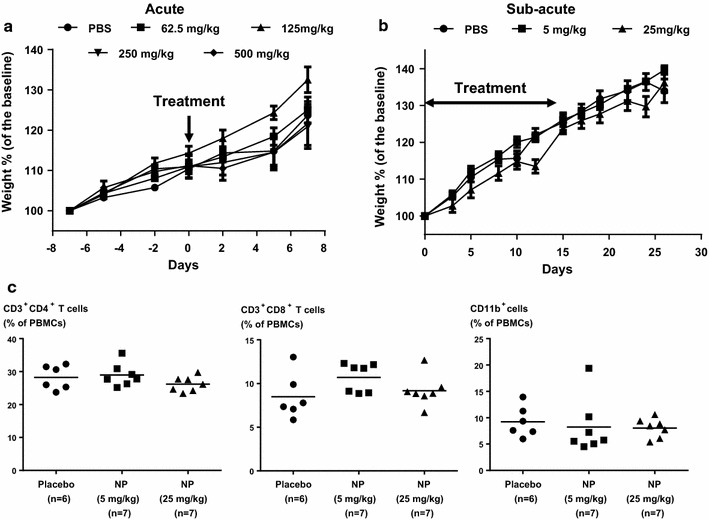
In vivo toxicity evaluation of YPMS@PpIX@FA. For acute toxicity, 25 CD-1 mice were i.v. injected with the indicated doses of nanoparticles (n = 5 per group). a Percent change of mouse body weight. The results are shown as mean values ± SEM. Differences were tested using a 2-way ANOVA. For sub-acute toxicity, three groups of mice were i.v. injected with the indicated doses of nanoparticles (n = 7 per group) or PBS (control group, n = 6), thrice a week for 2 weeks. After last injection, blood was collected from the retro-orbital sinus of mice and T cell subsets were characterized by flow cytometry for CD3, CD4, CD8 and CD11b expression. b Percent change of mouse body weight. The results are shown as mean values ± SEM. Differences were tested using a 2-way ANOVA. c Effect of multiple doses of NP on the circulating levels of CD4+ and CD8+ T cells and myeloid cells. Results are represented as scatter plots and the bars indicate the average. Differences were tested using a 1-way ANOVA with Tukey posttest
