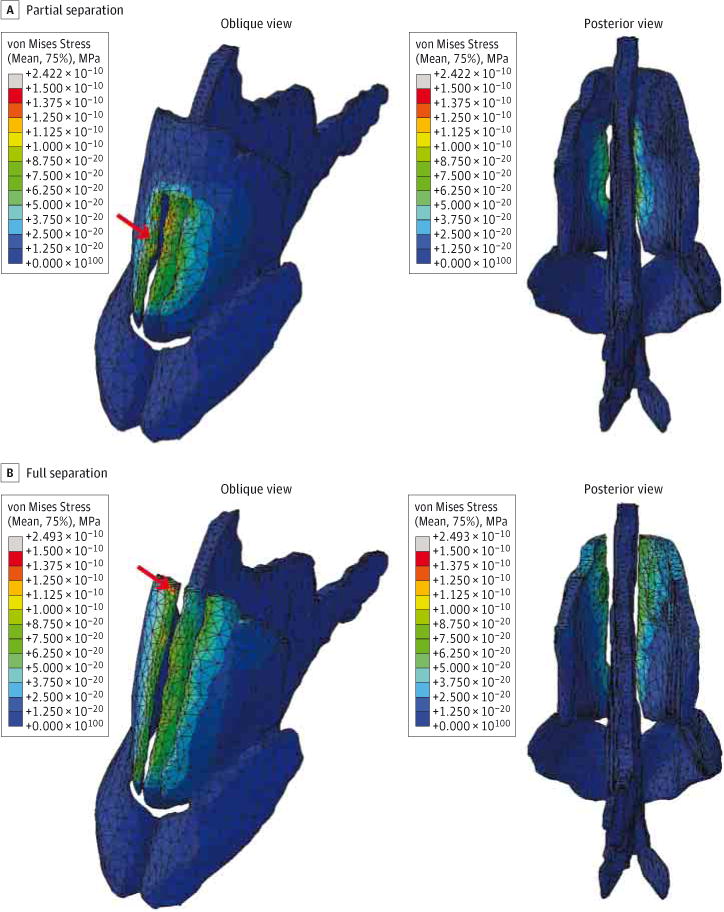
Figure 3. Surface Plot of von Mises Stresses on the Nasal Cartilages.

Stress values (in megapascals) are plotted on a color map scale where deep red indicates areas of highest stress and dark blue indicates no stress. Red arrows indicate the areas of peak stress.
