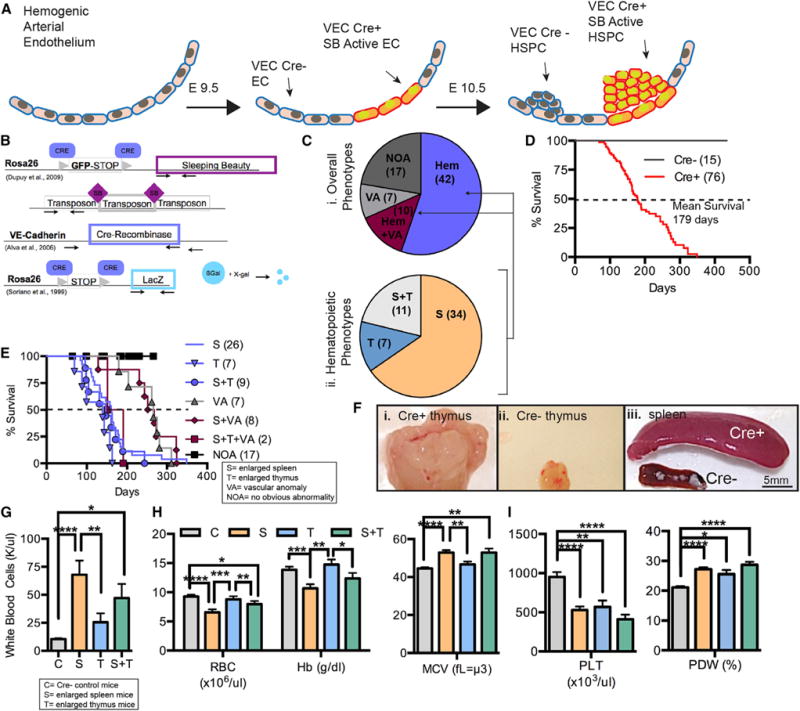
Figure 1. Initiating Mutagenesis in the Hemogenic Endothelium Generates Hematopoietic Malignancies.

(A and B) Onset of VE-Cadherin-Cre (VEC-Cre) expression, and therefore SB Transposase, at E9.5 in the progeny of (B) SB T2/Onc2; VEC-Cre/Rosa26-LacZ mice.
(C) Frequencies of abnormalities in these mice (i). Relative occurrence of enlarged spleens and thymus (ii).
(D) Overall survival of Cre+ and CrE− mice (number of mice in parentheses).
(E) Kaplan-Meier curve breakdown of animals with indicated maladies.
(F) Cre+ enlarged thymus (i), Cre− normal thymus (ii), Cre+ enlarged spleen and Cre− normal spleen (iii). Scale bar, 5 mm.
(G) White blood cell counts for Cre+ animals with enlarged spleens (S; n = 24), enlarged thymus (T; n = 5), or a combination of both (S+T; n = 10), Cre− littermates (n = 10).
(H) Red blood cell (RBC) concentration, hemoglobin (Hb) concentration, and mean cell volume (MCV) for Cre+ animals with an enlarged spleen (S; n = 24), thymus (T; n = 5), or both (S+T; n = 10) compared with Cre− controls (Cs; n = 10).
(I) Platelet concentrations (PLT) and platelet distribution width (PDW%) in S, T, S+T, and C animals.
(G–I) Data are represented as mean ± SEM, Student’s t test (*p ≤ 0.05; **p ≤ 0.01; ***p ≤ 0.001; ****p ≤ 0.0001) S, enlarged spleen; T, enlarged thymus; C, Cre negative; VT, vascular tumors; NOA, no obvious abnormalities; Hem, hematopoietic malignancy; HSPC, hematopoietic stem progenitor cell; Hb, hemoglobin; MCV, mean corpuscular volume; PLT, platelet count; PDW%, size distribution of platelet width.
