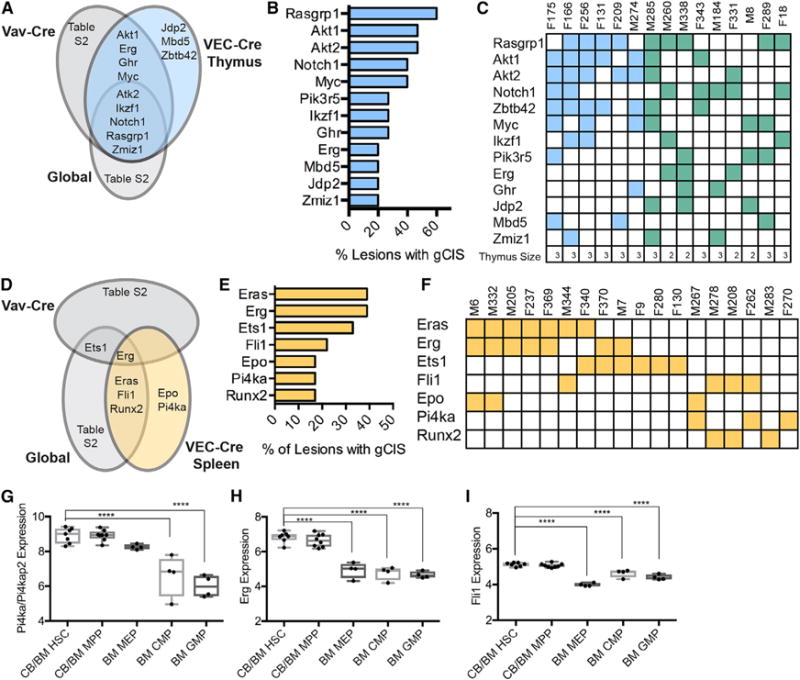
Figure 2. Thymus and Spleen Malignancies Have Distinct Gene Insertion Signatures.

(A) gCIS associated with thymic abnormalities in this screen when compared with others.
(B) Most commonly mutated genes in enlarged thymus.
(C) Distribution of mutated genes (rows) in each mouse (column). F, female; M, male. The number relates to the ID of the individual mouse. Enlarged thymus phenotype is shown in blue, enlarged spleen and thymus are depicted in green. Size of the thymus is shown at the bottom as a reference (3 > 500 mg, 500 > 2 > 100 mg, 1 < 100 mg).
(D) gCIS associated with splenic abnormalities in this screen compared with other screens.
(E) Most common gCISs in enlarged spleens.
(F) Several genes (rows) were often found together in the same lesion (column).
(G–I) mRNA expression as measured by microarray of myeloid-associated gCIS Pi4ka (G), Erg (H), and Fli1 (I) in different compartments from human bone marrow (BloodChIP); one-way ANOVA (*p ≤ 0.05; **p ≤ 0.01; ***p ≤ 0.001; ****p ≤ 0.0001). n = 4–8 per group.
See also Figures S1 and S2.
