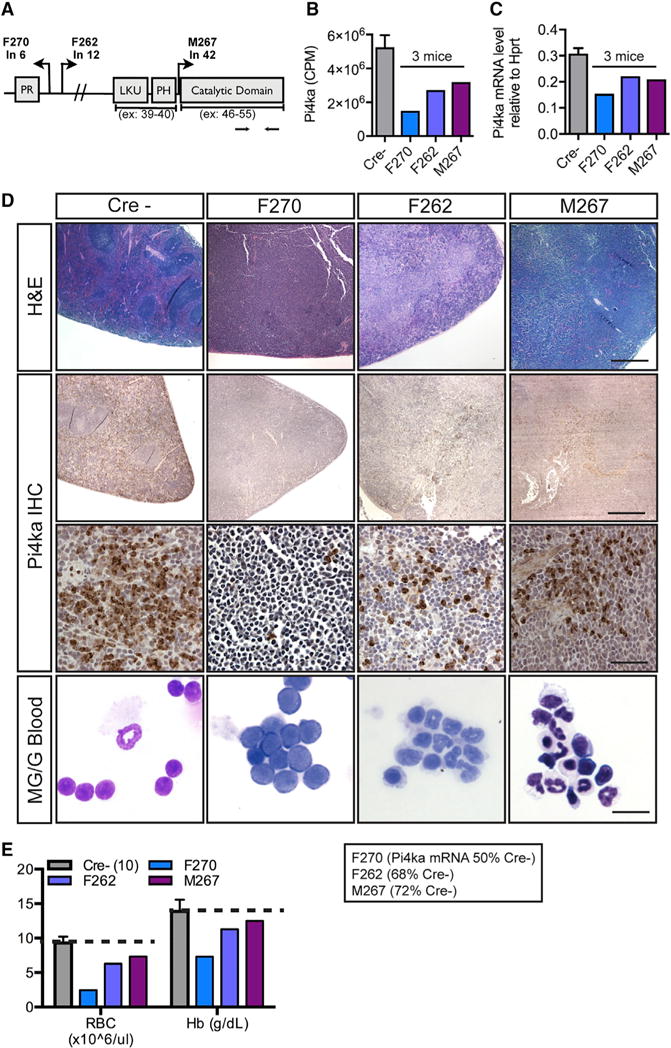
Figure 3. Transposon Insertions in the Pi4ka Gene Are Associated with Blast-like Phenotype and Decreased Red Blood Cells.

(A) Transposon insertions throughout the Pi4ka gene.
(B) Pi4ka RNA sequencing counts per million for affected and C spleens.
(C) Pi4ka expression by qPCR of the individual spleens from affected mice compared to Cre− spleens (n = 6).
(D) H&E of Cre− spleens and those with Pi4ka insertions (scale bar, 600 mm). Pi4ka immunohisto-chemistry (IHC) in spleens of C and affected mice (top: scale bar, 600 μm; middle: scale bar, 60 μm). Bottom: Cytospins of RBC-lysed blood from C and affected animals (scale bar, 15 μm)
(E) CBC analysis in C and Pi4ka-affected animals. For Cs (Cre−), data are represented as mean ± SEM of n = 10 animals.
