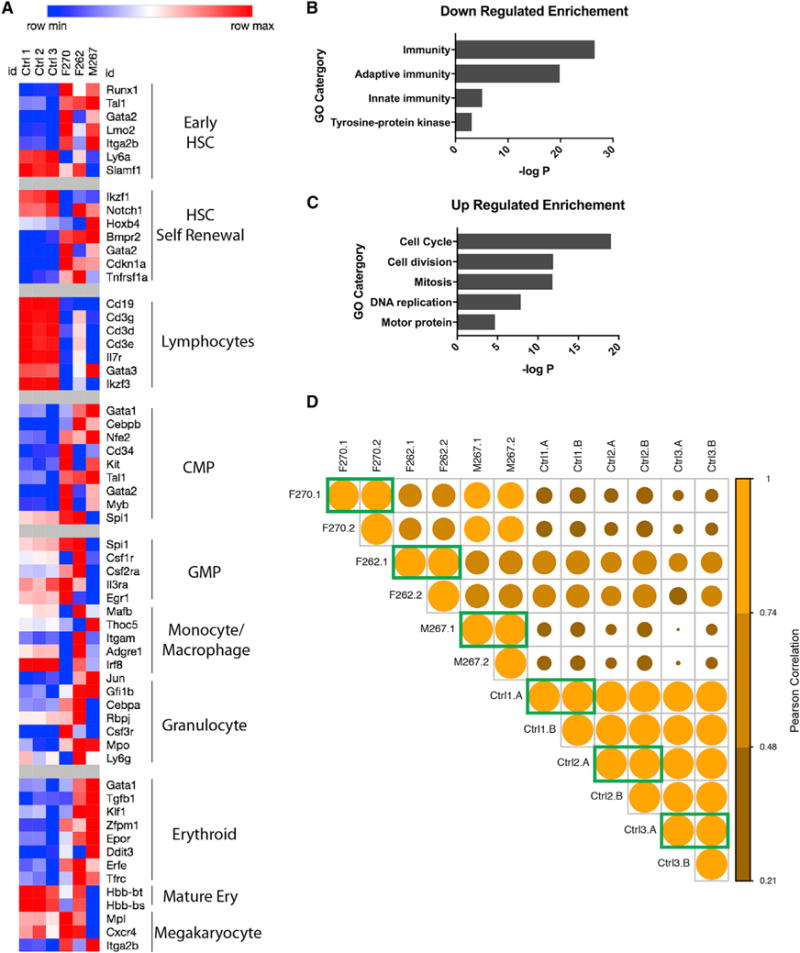
Figure 4. Molecular Characterization of Pi4ka Mutant Spleens.

(A) Hematopoietic gene transcriptional signatures for the three Pi4ka affected mice compared to three controls.
(B and C) Gene Ontology categories enriched by genes downregulated (B) and upregulated (C) greater than 2-fold.
(D) Clonal analysis comparing transcript counts for hematopoietic genes (as in A) between two regions of spleen removed from the same mouse (green boxes). Pearson correlations are color coded and visualized by circle size.
See also Figure S3.
