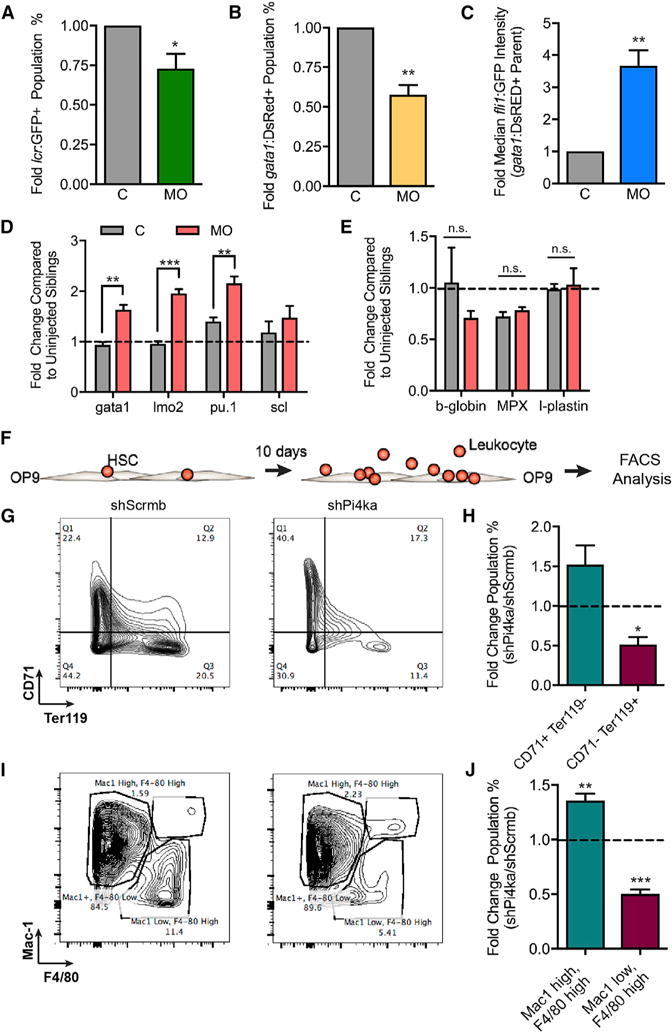
Figure 5. Loss of Pi4ka Decreases Erythroid Differentiation In Vivo and In Vitro.

(A) Percent of LCR-GFP cells in MO fish compared with C for three independent experiments. For each data point in (A)–(C), >100 embryos were pooled and data are represented as mean ± SEM.
(B) Percent Gata1-DsRED cells in MO fish compared with C for four independent experiments.
(C) Graph of median Fli1:GFP intensity of the Gata1:DsRED parent population for four independent experiments.
(D) RNA expression in 24 hpf whole C and morpholino-injected embryos for gata1, lmo2, pu.1, and scl transcripts for three to four independent experiments. For each data point in (D) and (E), 20 embryos were pooled and data are represented as mean ± SEM.
(E) RNA expression in whole C and morpholino injected fish for b-globin, MPX, and l-plastin.
(F) Illustration of in vitro mouse HSPC differentiation on an OP9 stromal layer for 10 days.
(G) Three independent experiments in which shScrmb- and shPi4ka-infected HSPCs grown on OP9 stromal cells were probed for CD71 and Ter119 expression by flow cytometry.
(H) Quantification of three independent experiments plotted as the fold difference of shScrmb and shPi4ka.
(I) Mac1+/− (Mac1 high/low) and F4/80+/− (F4/80 high/low) expression and quantification in the same cells described in (G).
(J) Quantification of four independent experiments.
Bars indicate SEM. Student’s t test and ANOVA were used to calculate significance between two groups (*p ≤ 0.05; **p ≤ 0.01; ***p ≤ 0.001; ****p ≤ 0.0001). See also Figure S4.
