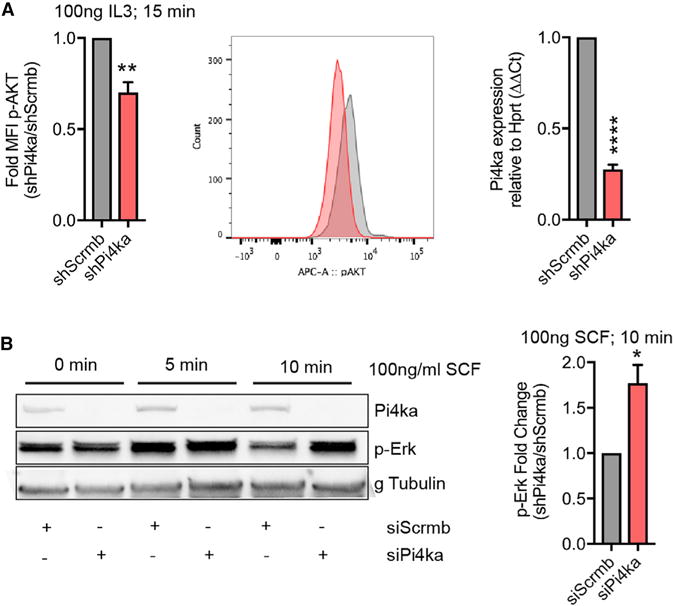
Figure 6. Loss of Pi4ka In Vitro Blunts Akt Signaling and Enhances ERK Signaling.

(A) Phospho-flow cytometry on 32D cells treated with 100 ng/mL IL-3 for 15 min. Fold change in MFI ratio of shPi4ka:shScrmb. Representative FACS plot (middle). Quantification of Pi4ka knockdown in 32D cells by qPCR (right) (summary of three independent experiments ± SEM).
(B) HEK293 cells treated with siScrmb and siPi4ka were stimulated with 100 ng/mL SCF for 0, 5, and 10 min. Protein lysates were probed for Pi4ka, p-ERK, and gamma tubulin, as loading C. Quantification (right) (summary of three independent experiments ± SEM).
Student’s t test and ANOVA were used to compare two conditions with statistical significance defined as *p ≤ 0.05; **p ≤ 0.01; ***p ≤ 0.001; ****p ≤ 0.0001. See also Figure S5.
