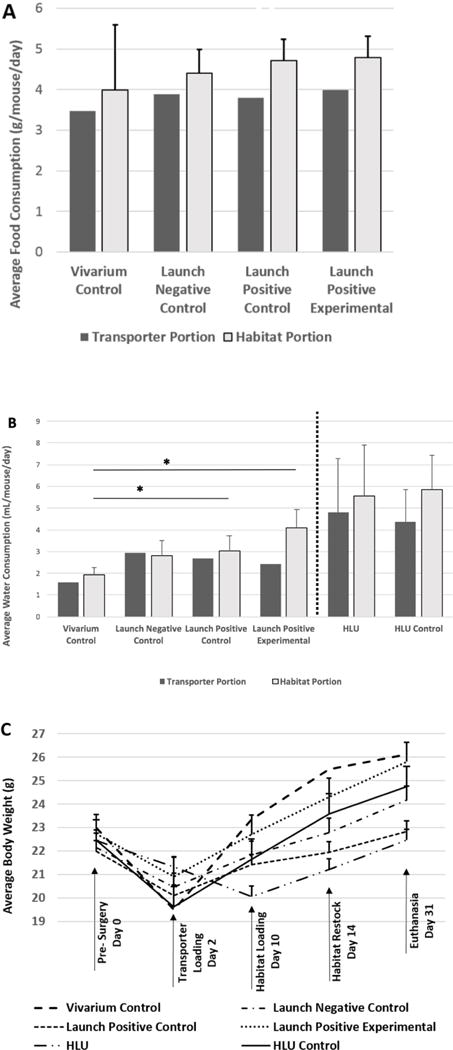
Figure 3. Apparent Food and Water Depletion and Mouse Weight.

(A) Apparent food and (B) water depletion were measured while the mice were housed in the different pieces of hardware. Mice were (C) weighed prior to surgery, 2 days after surgery (just before placement into Transporters), 1 week after launch simulation when mice were moved into Habitat cages, 2 weeks later when the Habitats were restocked with food and water, and at the time of euthanasia. Food and water consumption were expressed as values per mouse per day. Bars represent the mean ± SEM. There are no error bars associated with either food or water consumption during the Transporter phase because per standard protocol, the Transporter was only accessed after 7 days. Additionally, for the Habitat phase of the Launch Positive Experimental group, there were no water consumption error bars because the unit must be disassembled to take this measurement. No significant differences were detected between groups for food consumption during the Habitat phase. Significant differences were detected for water consumption between Vivarium and Launch Positive and Launch Positive Experimental groups (* indicates p<0.05) but not between Vivarium and Launch Negative groups (p>0.05). HLU and Vivarium/Habitat groups were not compared for water consumption due to different water delivery mechanisms (denoted by dotted line). However, HLU vs. HLU Controls were not significantly different from each other for water consumption. With regard to body weight, no significant differences were observed between the groups when using a repeated measures ANOVA followed by a Bonferroni post-hoc test (p<0.05).
