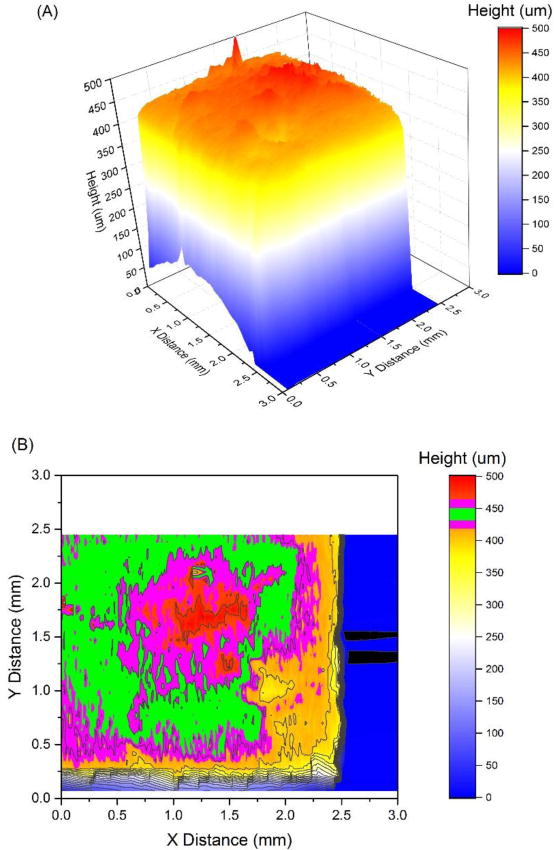
Figure 6.

Stylus profilometry 3-D map (A) and contour plot (B) of TangoBlackPlus exposed to 365 nm light (1.9 mW/cm2, 339 mJ/cm2). The green and magenta bands in the contour plot (B) represent regions with ± 2 % and ± 5 % differences from the average height of 440.3 µm.
