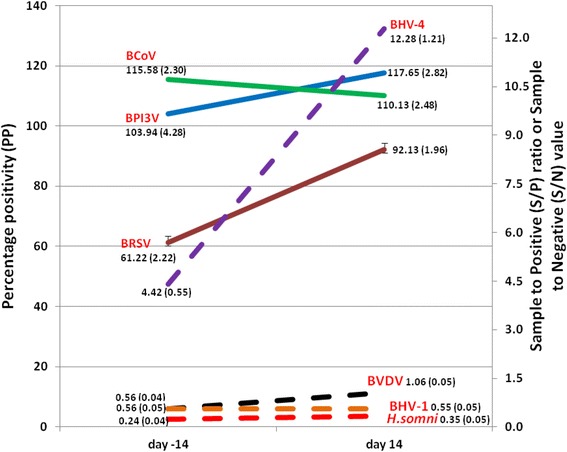
Fig. 1.

The mean values of the antibody levels (as reflected by S/P. PP or S/N values) to each of the BRD pathogens of interest and the standard error of the mean (in parantheses) at d − 14 and d 14 relative to weaning at d 0. Note that solid lines (BCoV PP, BPI3V PP, BRSV PP) are plotted against the left hand y-axis while the broken lines (BVDV S/P, BHV-4 S/P, BHV-1 S/N and H. somni S/P) are plotted against the right hand y-axis
