
Fig. 4.
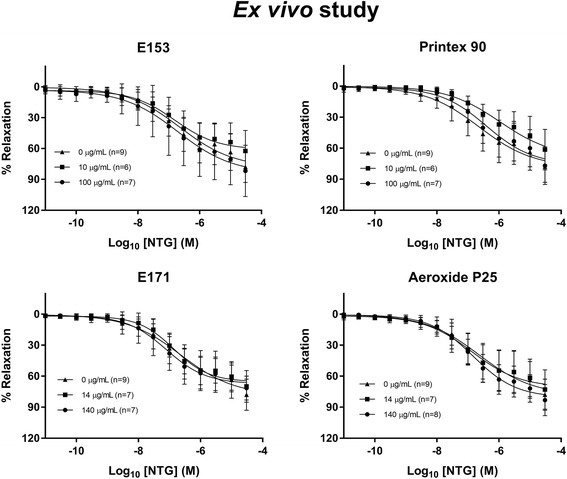
Nitroglycerine (NTG)-induced endothelium-independent vasorelaxation of rat aorta segments exposed ex vivo to particles. The nitroglycerine response is expressed as the % relaxation of the pre-contraction tension produced by PGF2a. Each point on the curves represents the cumulative response at each concentration of nitroglycerine. The data are presented as the mean ± SEM, n indicates the number of animals