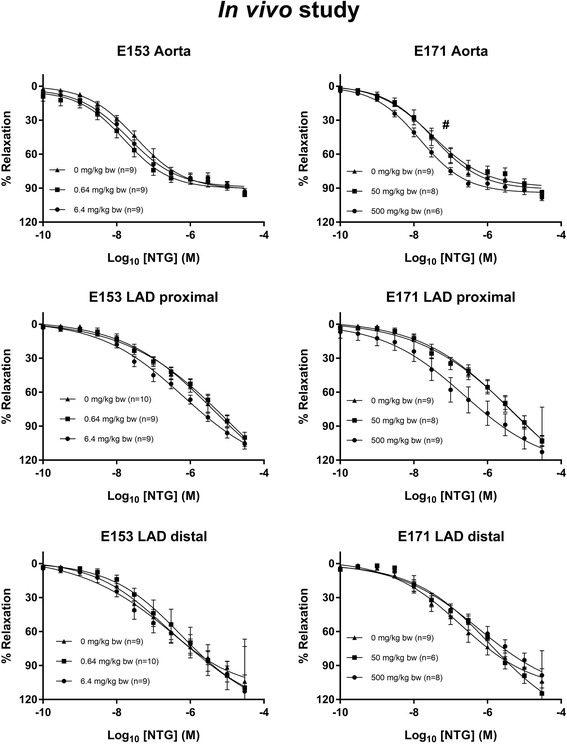
Fig. 7.

Nitroglycerine-induced endothelium-independent vasorelaxation of artery segments from rats exposed intragastrically to particles. The nitroglycerine response is expressed as the % relaxation of the pre-contraction tension produced by PGF2a. Each point on the curves represents the cumulative response at each concentration of nitroglycerine. The data are presented as the mean ± SEM, n indicates the number of animals. # denotes a statistically significant effect on log EC50 compared to the control group (P < 0.05)
