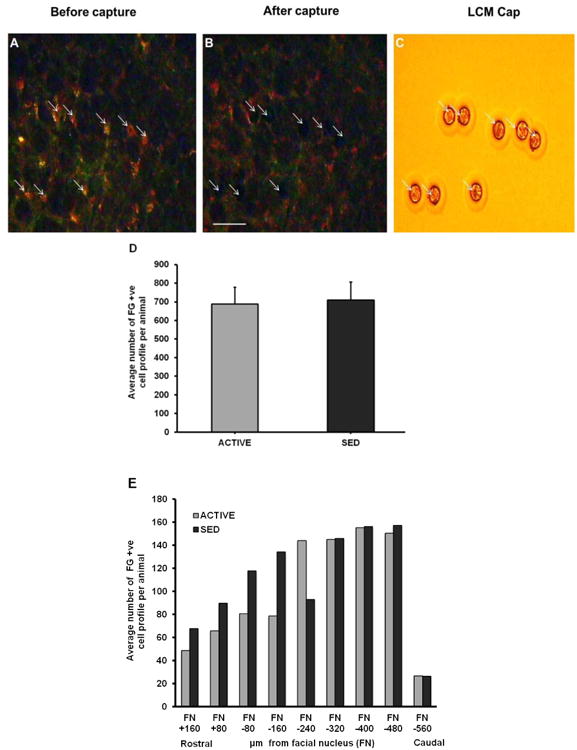
Figure 3. Laser capture microdissection in brainstem sections containing RVLM.

A) Representative section of Fluorogold-positive (FG +ve) neurons (arrows) before laser capture microdissection. B) Brainstem section following laser capture showing areas of removed cells (arrows). C) Captured cells are shown on the LCM cap (arrows). Scale bar, 100 μm. D) Representative section of post capture tissue demonstrating areas of cell capture within the predefined boundaries of the RVLM as described in the Methods section. Inset (D′) shows eight somatic profiles captured by the laser (D”=2× enlarged version of D′). E) Same tissue section from Figure 3D that was stained with Cresyl violet. Inset (E′) demonstrates capture of specific cell types (i.e. Fluorogold positive) and not other cell types located within and outside the region of the RVLM (compare identical location of capture sites numbered 1-8 in Figures 3D′ and 3E′) (E”=2× enlarged version of E′). Scale bar= 200 μm; NA=nucleus ambiguus; RVLM=rostral ventrolateral medulla; Py=Pyramidal tract.
