
Figure 4. Rostrocaudal distribution of spinally projecting cells collected via LCM in the RVLM.
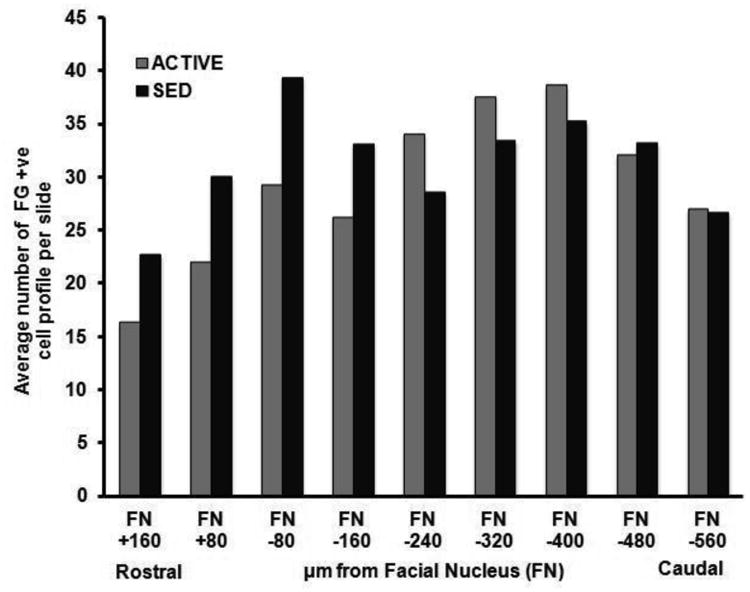
A) Bar graphs representing the average number of cells that were collected between sedentary and active rats. Data presented as mean ± S.E. B) Bar graphs represent the average number of cells collected in active and sedentary rats in a rostro-caudal manner. For ACTIVE:SED respectively n= 1:1 (FN +160), 1:1 (FN +80), 2:1 (FN -80), 4:2 (FN -160), 5:4 (FN -240), 5:4 (FN -320), 5:4 (FN -400), 4:4 (FN -480), 1:3 (FN -560). The number of animals precluded formal statistical analysis. C) Bar graphs represent the average number of Fluorogold-positive (FG +ve) cells collected per slide at each rostrocaudal level taken from active and sedentary animals. For ACTIVE:SED respectively n= 1:1 (FN +160), 1:1 (FN +80), 2:1 (FN -80), 4:2 (FN -160), 5:4 (FN -240), 5:4 (FN -320), 5:4 (FN -400), 4:4 (FN -480), 1:3 (FN -560). The number of animals precluded formal statistical analysis.