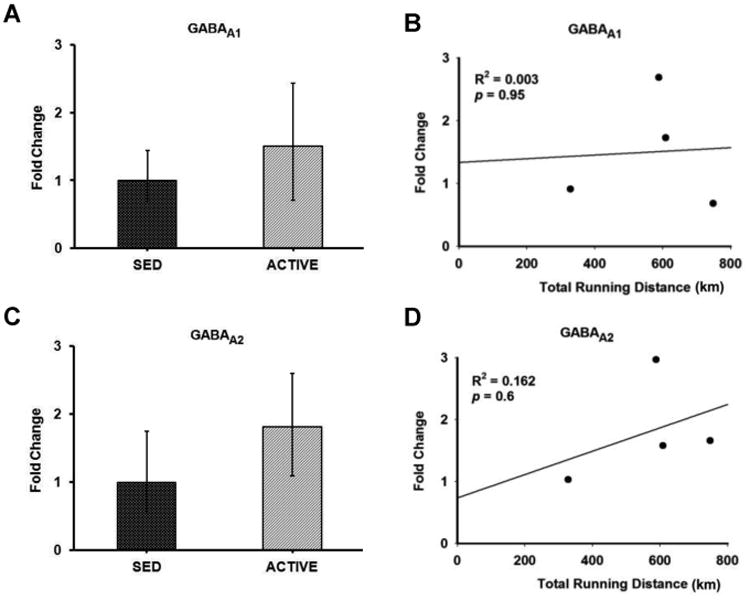
Figure 7. Gene expression and correlation of GABAA receptor subunits in the RVLM.

Bar graphs compare the gene expression of GABAA receptor subunits GABAA1 (A) and GABAA2 (C) in spinally-projecting RVLM neurons between sedentary and active rats measured by real-time qRT-PCR. Data presented as fold change ± S.D. Correlation was determined between the total running distance in active animals and fold change of GABAA receptor subunits GABAA1 (B) and GABAA2 (D) in spinally-projecting RVLM neurons. No correlation was observed between the running distance and gene expression of GABAA receptor subunits in the RVLM.
