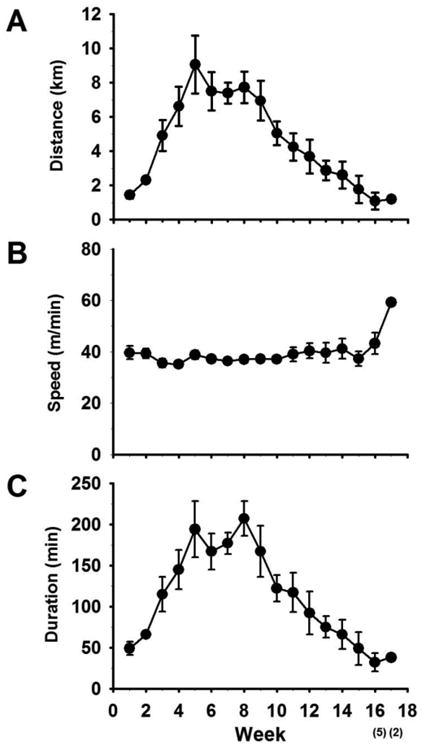
Figure 8. Average running distance over the course of the experiment.

The average weekly running distance (A) along with speed (B) and duration (C) are given here. Number of animals that contributed to the data was given within bracket in the x-axis.
