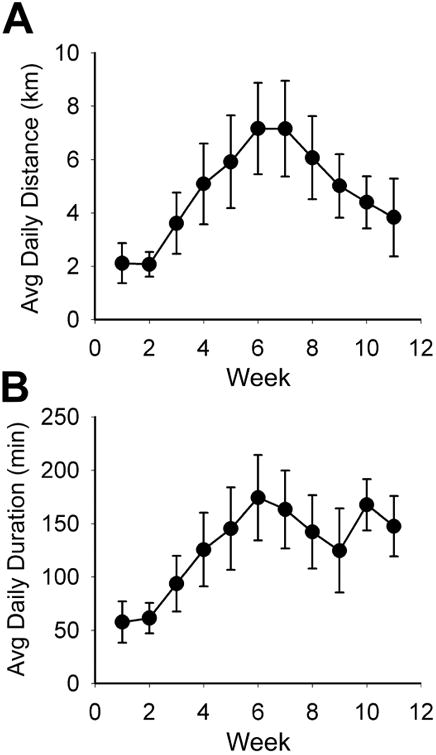
Figure 1. Average weekly running data for physically active rats.

Daily running by the six active rats used for morphological analysis. Activity of each rat on its in-cage running wheel was recorded with a bicycle computer. Average daily running distance (A) and duration (B) gradually increased with a peak at weeks 6-7 and then decreased from week 7 to 11. Average daily running speed did not vary during the course of the study (not shown). At 12 weeks, the rats received injections of CTB into T10 and were perfused seven days later.
